How to Monitor Your OpenShift Cluster with the Elastic Stack
Logs should be centralized, easily accessible, and independent from the monitored objects. Therefore, it’s advisable not to rely solely on the built-in monitoring system of OpenShift; instead, consider using an additional external monitoring solution. In this article, we’ll explore how to monitor an OpenShift cluster using Elastic Stack.
Installing the Integration
Since OpenShift is entirely based on Kubernetes, a custom integration isn’t necessary. We can utilize the widely supported Kubernetes integration. Let’s begin by installing it. Navigate to the integration section and search for Kubernetes.

Next, we need to create an agent policy. This policy should include the Kubernetes integration along with any other policies you wish to implement.

Setting up the Agents
Once this setup is complete, we can move on to the exciting part: installing the agents.
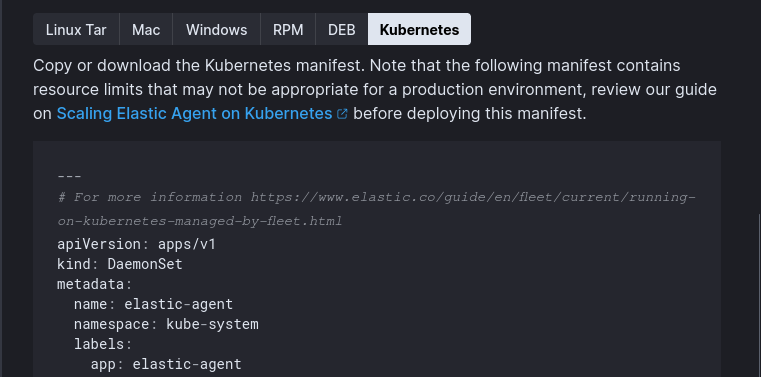
As expected, navigate to the Fleet > Add Agent section, select the OpenShift agent policy, and copy the manifest.

However, we can’t apply it directly; some minor customizations are necessary to ensure compatibility with OpenShift. Let’s go through these adjustments.
Use secrets
Always prioritize security by creating a secret that contains the fleet enrollment token. Modify the manifest section to utilize this secret instead of a plain token.
- name: FLEET_ENROLLMENT_TOKEN
  # No more plain tokens in the manifest; replace the line below
  # value: "AgentPolicyEnrollmentToken"
  valueFrom:
    secretKeyRef:
      name: fleet-enrollment-secret
Use the proper namespace
You may notice that the default namespace is set to kube-system. However, OpenShift has the openshift-monitoring namespace, which is specifically designated for monitoring applications. We should use this namespace instead, as it will be beneficial in subsequent steps due to the presence of kube-state-metrics deployments.
# Rename all namespace definitions from
# namespace: kube-system
# to:
namespace: openshift-monitoring

# ....
# Update 'kube-system' to 'openshift-monitoring'
volumes:
  - name: elastic-agent-state
    hostPath:
      path: /var/lib/elastic-agent-managed/openshift-monitoring/state
      type: DirectoryOrCreate
Mount the Elastic Certificate Authority
If your Elastic cluster uses a custom CA, you need to instruct the Elastic agents deployment to trust it. Create a secret with your custom CA and mount it accordingly.
# Add the env var in the container definition to specify where to get the CA from
env:
  - name: ELASTICSEARCH_CA
    value: "/etc/ssl/certs/my-custom-ca/root-ca.cer"

# ....
# Specify where to mount the CA volume
volumeMounts:
- name: wuerth-phoenix-ca
  mountPath: /etc/ssl/certs/my-custom-ca
  readOnly: true
# ...

# Add the definition of the CA volume
volumes:
  - name: my-custom-ca
    secret:
      secretName: my-custom-ca
Scrape the kube-state metrics
Typically, you would need to manually deploy kube-state-metrics, but OpenShift already has it deployed in the openshift-monitoring namespace for its internal monitoring. We simply need to retrieve metrics from it.
First, mount the certificate used by the kube-state-metrics endpoint. Since the agent will reside in the same namespace, we can access it directly:
# Specify where to mount the CA volume
volumeMounts:
  - name: kube-state-metrics-tls
    mountPath: /etc/ssl/certs/kube-state-metrics-tls
    readOnly: true

# Add the definition of the CA volume
volumes:
  - name: kube-state-metrics-tls
    secret:
      secretName: kube-state-metrics-tls
Next, explicitly configure the integration to retrieve the certificate from the previously defined path. Ensure that you edit the relevant sections of kube-state-metrics in the integration.
Make sure to set:
- host to
https://kube-state-metrics.openshift-monitoring.svc:8443 - SSL Certificate Authorities to
/etc/ssl/certs/kube-state-metrics-tls/tls.crt
There are many sections in kube-state-metrics, so patience is required to edit each one manually.
Conclusion
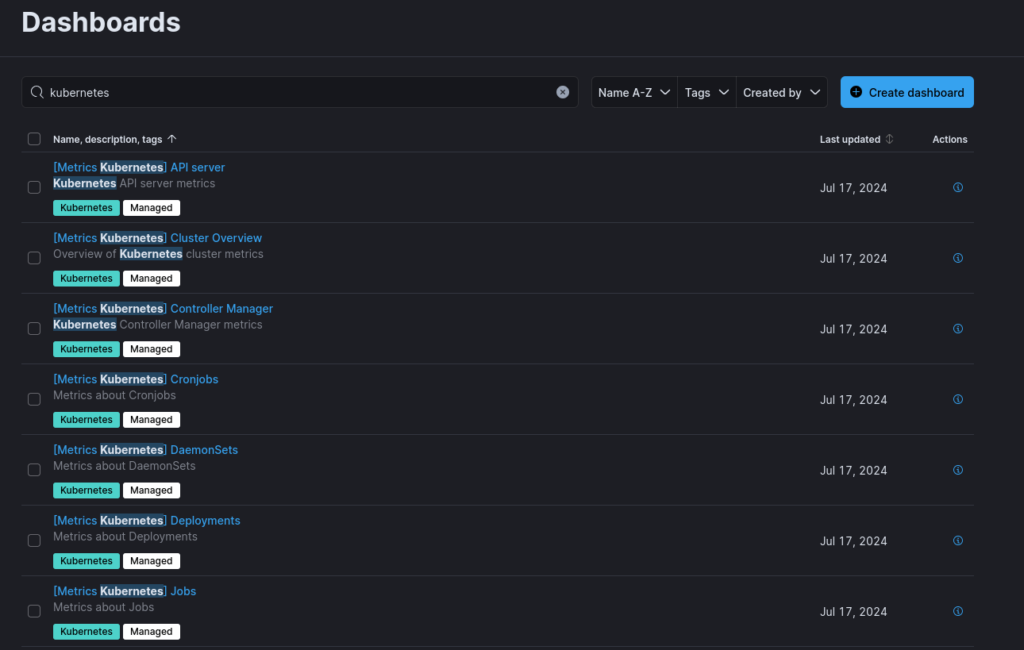
That’s it! After completing these configuration steps, you’ll be able to deploy the agents successfully, and they’ll start sending data to the cluster. Additionally, you can explore the ready-to-use dashboards provided by the integration.

If you encounter any issues or have additional questions, please feel free to reach out!
Interested in some more reading? Have a look at my previous post
These Solutions are Engineered by Humans
Did you find this article interesting? Does it match your skill set? Programming is at the heart of how we develop customized solutions. In fact, we’re currently hiring for roles just like this and others here at Würth Phoenix.


