


31. 03. 2025
NetEye, Service Management

12. 08. 2024
Csaba Remenar
ITOA, NetEye
How to Integrate Metrics Collected in OpenShift into NetEye/Grafana
OpenShift already has a built-in monitoring suite with Prometheus, Grafana, and Alertmanager. This is all well and good, but what if organizations want to monitor their entire infrastructure, integrating all monitoring results under one umbrella? In this case, it’s necessary to send the metrics somehow from OpenShift to NetEye.
In this tutorial, I’ll show you how to integrate metrics collected in OpenShift into NetEye/Grafana in two different ways. Each approach is quite different and suited to different needs.
Integration method 1: With this strategy we want to collect all metrics into a local time series database. Your first reaction might be “why duplicate the metrics?” We’ll see the pros and cons at the end of this post.
Integration method 2: Consume all metrics provided by Prometheus directly in Grafana.
Method 1
In this example, we’ll create one remote write endpoint using the Telegraf http_listener_v2 plugin.
Let’s start with a simple OpenShift configuration. The first step is to create the certificates for the OpenShift remote write configuration. For simplicity’s sake, you can use a script already available in NetEye, which by default uses the CA in the /root/security/ca/ directory.
Let’s create a few variables for clarity:
openshift_domain=<openshift fqdn>
neteye_vip_domain=<NetEye vip fqdn>
neteye_vip_ip=<NetEye vip ip>
listener_port="${listener_port:-8186}"
/usr/share/neteye/scripts/security/generate_client_certs.sh $openshift_domain \
    "/CN=openshift/OU=neteyeclient/O=client/L=Bolzano/ST=BZ/C=IT" \
    /root/security/openshift/
At the same time, create the Telegraf collector certificate too, which we’ll need later:
/usr/share/neteye/scripts/security/generate_server_certs.sh \
   '/C=IT/ST=BZ/L=Bolzano/O=GlobalSecurity/OU=NetEye/CN=${neteye_vip_domain}' \
   "$neteye_vip_domain" $neteye_vip_ip \
   $neteye_vip_domain /root/security/telegraf/
OpenShift uses secrets to load certificates, and it’s necessary to encode them in Base64:
cat /root/security/openshift/certs/${openshift_domain}.crt.pem | base64 -w 0 > cert_base64.txt
cat /root/security/openshift/certs/private/${openshift_domain}.key.pem | base64 -w 0 > key_base64.txt
cat /root/security/ca/root-ca.crt | base64 -w 0 > ca_base64.txt
Then of course we create the secret in OpenShift using the previously generated Base64 data:
oc apply -f - <<EOF
apiVersion: v1
kind: Secret
metadata:
  name: mtls-bundle
  namespace: openshift-monitoring
type: tls
data:
## contents of ca_base64.txt cert_base64.txt key_base64.txt ####
  ca.crt: Q2VydGlmaWNhdGU6CiAgICBEYXRhOgogICAgI...ZkxvUXE0PQotLS0tLUVORCBDRVJUSUZJQ0FURS0tLS0tCg==
  client.crt: LS0tLS1CRUdJTiBDRVJUSUZJQ0FURS0tL...BPT0KLS0tLS1FTkQgQ0VSVElGSUNBVEUtLS0tLQo=
  client.key: LS0tLS1CRUdJTiBQUklWQVRFIEtFWS0tL...NEeTIKLS0tLS1FTkQgUFJJVkFURSBLRVktLS0tLQo=
EOF
I also modify (or if it doesn’t already exist, create) the “cluster-monitoring-config” ConfigMap in the “openshift-monitoring” namespace and set the remoteWrite configuration. I recommend configuring this through the OpenShift WebUI.
kind: ConfigMap
apiVersion: v1
metadata:
  name: cluster-monitoring-config
  namespace: openshift-monitoring
data:
  config.yaml: |
    prometheusK8s:
      remoteWrite:
      - url: "<https://${neteye_vip_domain}:${listener_port}/receive>"
        tlsConfig:
          ca:
            secret:
              name: mtls-bundle
              key: ca.crt
          cert:
            secret:
              name: mtls-bundle
              key: client.crt
          keySecret:
            name: mtls-bundle
            key: client.key
		writeRelabelConfigs:
        - sourceLabels:
          - "__name__"
          action: "keep"
          regex: ":|openshift_auth_form_password_count_result|openshift_auth_password_total|openshift_cluster_storage_operator_build_info|openshift_config_operator_build_info|openshift_console_operator_build_info|openshift_controller_manager_operator_build_info|openshift:cpu_usage_cores:sum|openshift_etcd_operator_build_info|openshift_group_created|openshift_group_user_account|openshift_imagestreamcontroller_success_count|openshift_ingress_to_route_controller_ingress_without_class_name"
Note the “writeRelabelConfigs,” which in this case sends only those metrics that match the “regex” to the remote write endpoint.
Now you need to configure the remote write endpoint in NetEye which we previously set in OpenShift. To configure this, as I mentioned earlier, I chose Telegraf, since it’s already integrated into NetEye, and it’s possible with a simple setup to create an HTTPS protocol for the connection.
To receive data from Prometheus, we’ll use the http_listener_v2 plugin. We also use the Starlark processor to properly process the metrics from Prometheus to InfluxDB.
In summary, we’ll need a collector as an endpoint and a consumer that sends the data to a database via the NATS server. As these are local services, they need to be configured on each of the Operative-Nodes:
...
###############################################################################
#                            OUTPUT PLUGINS                                   #
###############################################################################
# # Send telegraf measurements to NATS
[[outputs.nats]]
   servers = ["nats://nats-server.neteyelocal:4222"]
   subject = "telegraf.openshift"
   secure = true

   tls_ca = "/neteye/local/telegraf/conf/certs/root-ca.crt"
   tls_cert = "/neteye/local/telegraf/conf/certs/telegraf_wo.crt.pem"
   tls_key = "/neteye/local/telegraf/conf/certs/private/telegraf_wo.key.pem"

   data_format = "influx"


###############################################################################
#                            INPUT PLUGINS                                    #
###############################################################################
	[[inputs.http_listener_v2]]
	  service_address = ":8186"
	  paths = ["/receive"]

	  tls_allowed_cacerts = ["/neteye/shared/telegraf/conf/certs/root-ca.crt"]
	  tls_cert = "/neteye/shared/telegraf/conf/certs/neye.locdev.net.crt.pem"
	  tls_key = "/neteye/shared/telegraf/conf/certs/private/neye.locdev.net.key"

	  data_format = "prometheusremotewrite"

	  [[processors.starlark]]

	# Specifically for prometheus remote write - renames the measurement name to the fieldname. Renames the fieldname to value.
	# Assumes there is only one field as is the case for prometheus remote write.
	#
	# Example Input:
	# prometheus_remote_write,instance=localhost:9090,job=prometheus,quantile=0.99 go_gc_duration_seconds=4.63 1618488000000000999
	#
	# Example Output:
	# go_gc_duration_seconds,instance=localhost:9090,job=prometheus,quantile=0.99 value=4.63 1618488000000000999
#####
source = '''
def apply(metric):
   if metric.name == "prometheus_remote_write":
		for k, v in metric.fields.items():
			metric.name = k
			metric.fields["value"] = v
			metric.fields.pop(k)
   return metric
	'''
We prepare the telegraph consumer configuration, which is used to write the incoming data into the InfluxDB database:
...
###############################################################################
#                            INPUT PLUGINS                                    #
###############################################################################
# Read metrics from NATS subject(s)
[[inputs.nats_consumer]]
   servers = ["nats://nats-server.neteyelocal:4222"]
...
   data_format = "influx"

###############################################################################
#                            OUTPUT PLUGINS                                   #
###############################################################################
# Configuration for sending metrics to InfluxDB
[[outputs.influxdb]]
  urls = ["<https://influxdb.neteyelocal:8086>"]
  database = "openshift"
  skip_database_creation = true
  retention_policy_tag = "retention_policy"

  username = "telegraf_master"
  password = "<.passwd_influxdb_telegraf_master>"
...
Of course, you’ll need to create the InfluxDB database with the retention policy and, if necessary, open the Telegraf listener port in the firewall (in this case, port 8186).
Before starting the service you can test the endpoint if you want with the following command:
telegraf --debug --config /neteye/local/telegraf/conf/telegraf_collector_openshift.conf --test-wait 5
If the test works, then we can activate the services:
systemctl enable --now telegraf-local@neteye_consumer_openshift_influxdb
systemctl enable --now telegraf-local@telegraf_collector_openshift
All you have to do now is create the Grafana data source with the credentials to access the newly created database.
To summarize what we did, we write the metrics using Prometheus’ remote write technology and store them in the InfluxDB database using the Telegraf and NATS streaming services.
Now let’s look at the second option.
Method 2
So here I’ll directly configure the Prometheus server as a data source in Grafana.
First I need to create a secret-based token in OpenShift. This token will be used for authorization:
oc apply -f - <<EOF
apiVersion: v1
kind: Secret
metadata:
  name: prometheus-robot-secret
  namespace: openshift-monitoring
  annotations:
    kubernetes.io/service-account.name: prometheus-k8s
type: kubernetes.io/service-account-token
EOF
Before we set up Grafana, we test for availability. To do this, we retrieve the URL of the Prometheus API and the token that we’ll use later in Grafana:
PROMETHEUS_URL=$(oc get route -n openshift-monitoring prometheus-k8s -o jsonpath="{.status.ingress[0].host}")
TOKEN=$(oc -n openshift-monitoring extract secret/prometheus-robot-secret --to=- --keys=token)
Then we use a curl command to query it:
curl -sk -H "Authorization: Bearer $TOKEN" https://$PROMETHEUS_URL/api/v1/alerts
The result will end up something like this:
{"status":"success","data":{"alerts":[{"labels":{"alertname":...}Now we can configure the Grafana data source with the extracted Prometheus URL and token:
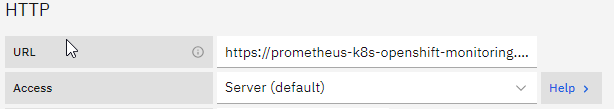
1. Add a new data source and choose Prometheus
2. Fill in the name
3. On Connection, add the extracted Prometheus API URL
4. For Authentication choose “Forward OAuth Identity” as the authentication method and skip TLS Certificate Validation, when using an untrusted certificate. For HTTP Headers, add Header, and fill in the Header with “Authorization” and fill in the Value with the token like this: “Bearer sImYmVybmV0ZX...50Lm5hbWU“.
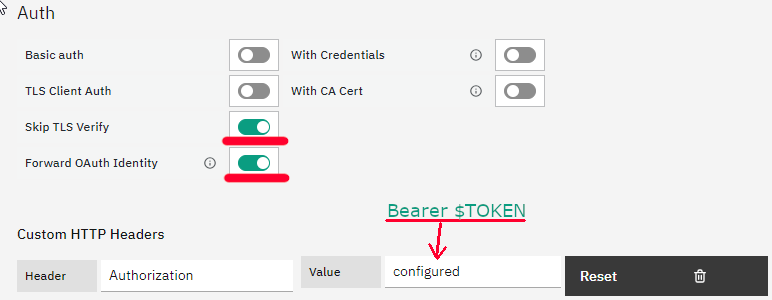
5. Click “Save & Test”, and if everything goes well, you’ll see the response Data source is working .
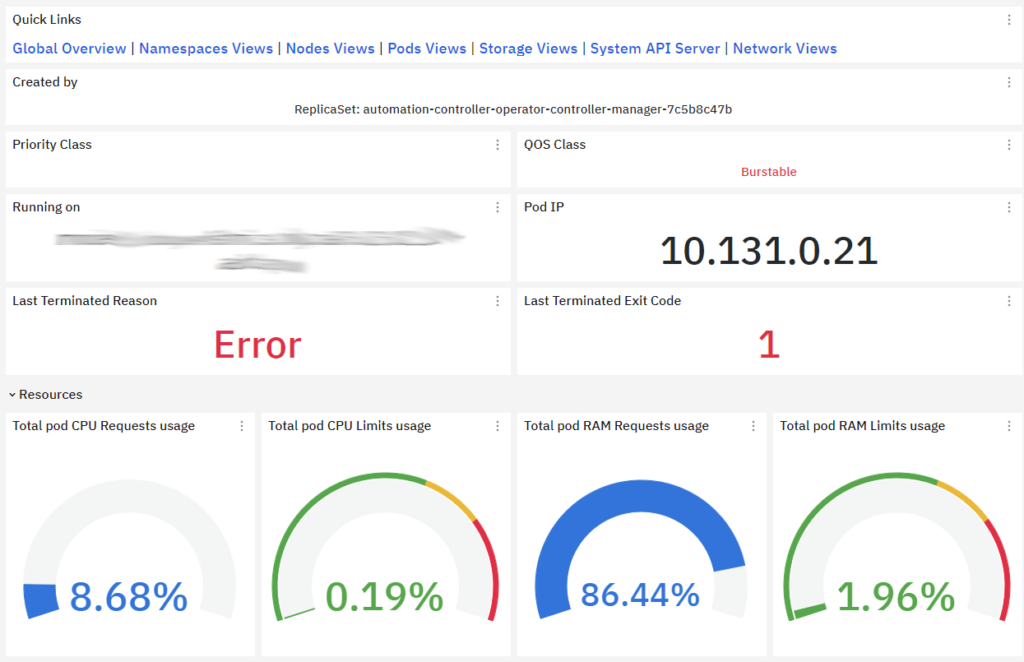
We can now import ready-made dashboards for OpenShift and customize them to our own requirements if needed.
While we’re at it, let me highlight some important indicators you should watch out for.
Cluster Capacity: Tracking cluster capacity metrics such as total CPU and memory capacity, as well as available resources, helps with capacity planning and ensuring that the cluster can efficiently handle the workload.
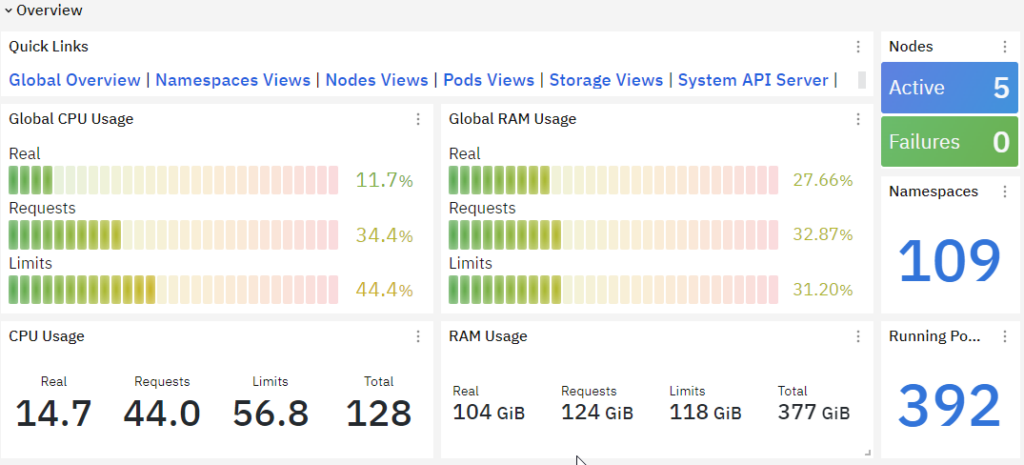
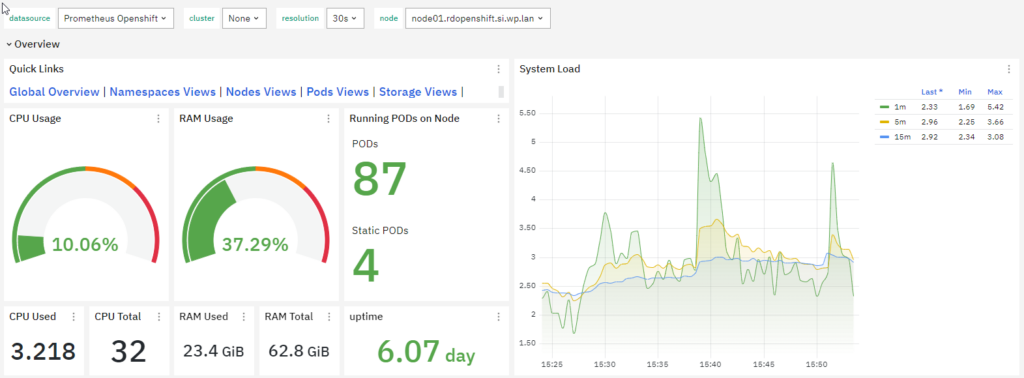
Node Metrics: Node metrics include CPU and memory usage per node, disk I/O, network bandwidth utilization, and node capacity. Monitoring these metrics helps in optimizing node resource allocation and identifying any performance issues.
Pod Metrics: Monitoring metrics related to pods, such as the number of running pods, pending pods, restart count, and pod status, helps in understanding the overall health of the applications running in the cluster.
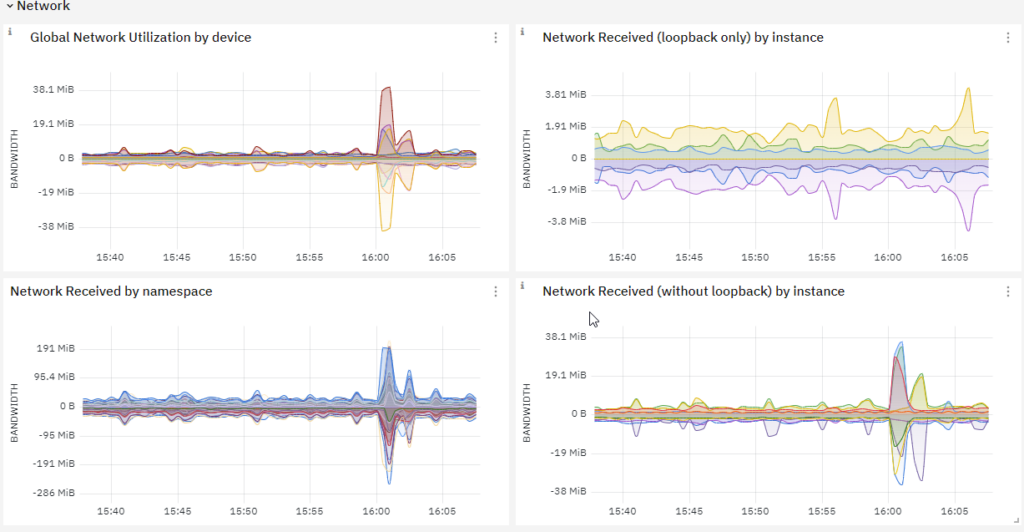
Cluster Network Performance: Monitoring network metrics such as network latency, packet loss, and throughput helps in ensuring optimal network performance for communication between pods and nodes within the cluster.
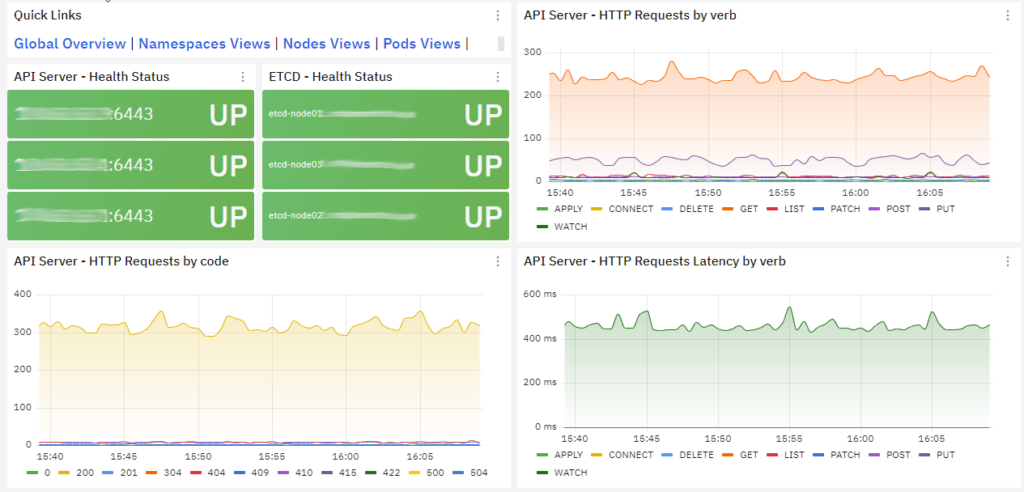
Kubernetes API Server Metrics: Monitoring metrics related to the Kubernetes API server, such as request latency, error rates, and API server availability, helps in ensuring the responsiveness and reliability of the Kubernetes control plane.
Conclusion
Let’s compare the two methods.
The advantage of Method 1 is that you can easily filter and select certain metrics, set a long retention policy in InfluxDB, and even set up multiple endpoints, for example, another one for backing up the entire Prometheus database. The disadvantage is the (slightly) complicated installation and the lack of pre-made dashboards.
The advantage of Method 2 is that it’s easy to configure, and many different pre-made Grafana dashboards are available, which can be simply and quickly integrated into Grafana/NetEye and customized according to the customer’s preferences. However, it’s important to note — and this would be its drawback — that Prometheus integrated into OpenShift is not intended for long-term storage of metrics. Large retention values can cause performance issues, and therefore the system uses a short retention time, by default 15 days.
At the links below you’ll find quite a few pre-made dashboards for the OpenShift cluster. Have fun!
These Solutions are Engineered by Humans
Are you passionate about performance metrics or other modern IT challenges? Do you have the experience to drive solutions like the one above? Our customers often present us with problems that need customized solutions. In fact, we’re currently hiring for roles just like this as well as other roles here at Würth Phoenix.
Csaba Remenar
Technical Consultant at Würth Phoenix
Author
Latest posts by Csaba Remenar
31. 03. 2025
NetEye, Service Management
Improving Your Backup of MariaDB