


26. 03. 2025
Development, NetEye

30. 11. 2023
Juergen Vigna
Log Management, Log-SIEM, NetEye, Unified Monitoring
Monitor Your Elasticsearch Agents Registered in the Elastic Fleet Server
Say you’re using the SIEM Module in NetEye and are deploying the Elasticsearch Agent to your clients. You’d surely like to know if those agents are still sending data and are still connected to the Elastic Fleet server. I had this problem recently and came up with a new monitoring plugin that uses the Kibana-API to monitor the status of your Agents.
You can download this plugin from: check_elastic_fleet_agents_status.pl.
# /neteye/shared/monitoring/plugins/check_elastic_fleet_agents_status.pl --help
check_elastic_fleet_agents_status.pl, Version 1.0.0
Copyright (c) 2020 Juergen Vigna
This program is licensed under the terms of the
GNU General Public License
(check source code for details)

Get status of Elastic Agents registered in Fleet Server

Usage:
  check_elastic_fleet_agents_status.pl [-H|--host <hostname/ip>] [-p|--port <tcp-port>] [-U|--user <username>] [-P|--password <password>] [-T|--testonly]
  check_elastic_fleet_agents_status.pl [-h | --help]
  check_elastic_fleet_agents_status.pl [-V | --version]

 -V (--version)   Programm version
 -h (--help)      usage help
 -v (--verbose)   verbose output
 -D (--debug)     debug output
 -H (--host)      Kibana Server hostname/ip (default: kibana.neteyelocal)
 -p (--host)      Kibana Server port (default: 5601)
 -U (--user)      Kibana User (default: kibana_monitor)
 -P (--password)  Kibana User Password (default: ***)
This plugin will connect to the Kibana Server API and get the status of the agents registered in the Elastic Fleet, checking whether the status of the agent is online or offline.
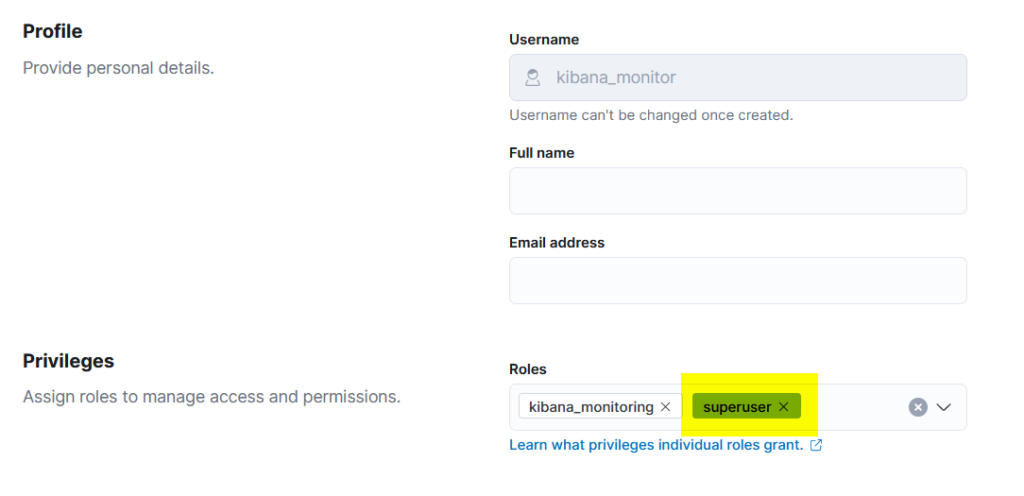
The important part is to configure a user to access the Kibana API. Unfortunately as of now, the Kibana Fleet API is only reachable if the user you connect with has “superuser” rights in Kibana.
Running the plugin will give you output like this:
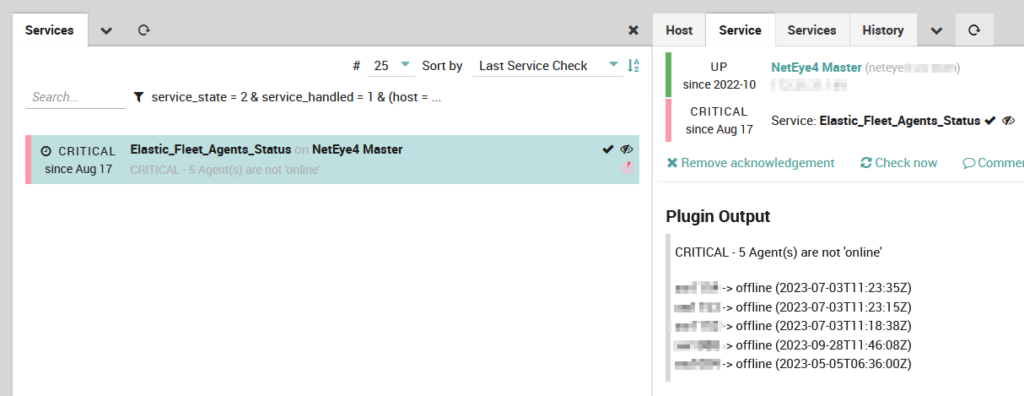
So now you can actively check that all your agents are still connected to the Elasticsearch Fleet Server and are still sending data.
These Solutions are Engineered by Humans
Did you like this article? Does it reflect your skills? We often get interesting questions straight from our customers who need customized solutions. In fact, we’re currently hiring for roles just like this and others here at Würth Phoenix.

Juergen Vigna
NetEye Solution Architect at Würth Phoenix
I have over 20 years of experience in the IT branch. After first experiences in the field of software development for public transport companies, I finally decided to join the young and growing team of Würth Phoenix. Initially, I was responsible for the internal Linux/Unix infrastructure and the management of CVS software. Afterwards, my main challenge was to establish the meanwhile well-known IT System Management Solution WÜRTHPHOENIX NetEye. As a Product Manager I started building NetEye from scratch, analyzing existing open source models, extending and finally joining them into one single powerful solution. After that, my job turned into a passion: Constant developments, customer installations and support became a matter of personal. Today I use my knowledge as a NetEye Senior Consultant as well as NetEye Solution Architect at Würth Phoenix.
Author
Latest posts by Juergen Vigna
30. 08. 2024
Log-SIEM, NetEye, Unified Monitoring
Monitor your Elasticsearch Shards Count
02. 07. 2024
NetEye
Monitor the Tasks in the Windows Task Scheduler