Monitor Cisco’s APIC FAULT (Application Policy Infrastructure Controller) in NetEye 4
Introduction
As introduced in a previous post, Cisco’s APIC is a core component for several of our customers; it’s a complex solution that every user can employ to fully customize their configuration. There I explained how to monitor the APIC at a high level, summarizing the fault information tenant by tenant. Some customers needed to monitor faults at a deeper level, so I developed this updated approach.
Solution
The main components of this new approach are a python script, a Tornado rule and some templates.
- Service Template
- generic-active-fault-service-apic: a template applied to the services that call the check_apic_fault.py script
- generic-passive-fault-service-apic: a template used for all services dynamically created/updated by Tornado
- Tornado Rule: Tornado exposes a webhook and has a rule (apic_webhook_manage) that dynamically creates/updates services related to an APIC Fault using a smart_monitoring_action
- Script check_apic_fault.py: this is the core of the solution. It calls the APIC and Icinga API. It queries the APIC REST API at /api/node/class/faultInfo.json in order to obtain the actual faults, applies some filters (tenant, fault code), and maps the APIC severities to the proper Icinga Level (Ok, Warning, Critical). It then performs some additional checks via the NetEye Icinga API in order to find out if any faults have disappeared from CISCO APIC. When detailed Fault information is ready, it calls the Tornado webhook in order to create or update the service linked to this fault.
Using these three elements, I built an HA solution where the checks, installed and configured on a pair of APIC physical nodes, create/update services with the fault status in a virtual host (i.e., APIC-virtual). So we start with the creation of a “Dummy” Host (apic-virtual) with these two services.
- apic-virtual (Host)
- APIC Fault – F112296 – Node1 (Service on Node1)
- APIC Fault – F112296 – Node2 (Service on Node2)
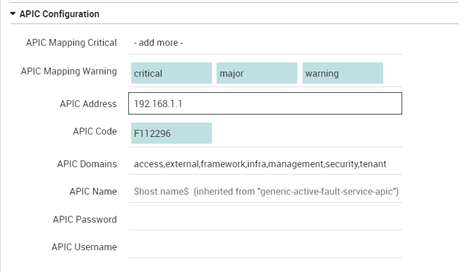
Each of these services calls the check_apic_fault script on a different node and filters for Fault code. This command can be configured using these fields as in the screenshot below:
- APIC Name: Host name for the services that will be created
- APIC Address: APIC node address (IP/FQDN)
- APIC Username: APIC Username
- APIC Username: APIC Password
- APIC Code: Filter for the APIC Fault code
- APIC Domains: Filter for APIC Domains
- APIC Mapping Warning: Maps the APIC Severity to this Icinga Warning status
- APIC Mapping Critical: Maps the APIC Severity to this Icinga Warning status

The final result is a host where there are 2 services that call the script and a list of services that indicates the faults (i.e., F112296::threshold-crossed::E/F/G/ [A/B/C]/fault-F112296). Every service will be automatically created, updated or solved by the framework that we have described in this post.

An additional feature for dynamically removing old services(FAULT) has been recently added and will be described in a future post.

These Solutions are Engineered by Humans
Did you read this article because you’re knowledgeable about networking? Do you have the skills necessary to manage networks? We’re currently hiring for roles like this as well as other roles here at Würth Phoenix.


