


30. 03. 2025
NetEye, Unified Monitoring


In this article I’ll talk about Icinga DSL and how it can be extremely useful if you want to compute thresholds.
Our goal today is to be able to change certain monitoring thresholds when some parameters change.
Example
The example I propose is the following:
I’m a system administrator, and I would like the warning and critical monitoring thresholds for disk space on my servers to be based on their partition size.
What the system administrator is asking here is actually helpful:
If the partition to be monitored is very large, he would like to set higher thresholds, for example 90% for warning and 95% for critical, otherwise 80% for warning and 90% for critical.
To find out the total space of the partition we can execute the following Icinga DSL call:
<1> =>  get_service("NetEye Master", "NetEye diskspace").last_check_result.performance_data[5]
[ "/neteye=841MB;9085;10804;0;12278" ]
Where NetEye Master is the host and NetEye diskspace is the service.
Now we have to extract the value 12278, which turns out to be the value labelled “max”. To obtain it we can use the “parse_performance_data” function:
<2> => diskstringc=get_service("NetEye Master4", "NetEye diskspace").last_check_result.performance_data[5]
<3> => parse_performance_data(diskstringc)
{
counter = false
crit = 11457789952.000000
label = "/neteye"
max = 12874416128.000000
min = 0.000000
type = "PerfdataValue"
unit = "bytes"
value = 927989760.000000
warn = 10170138624.000000
}
The Script
At this point we can already write the complete script:
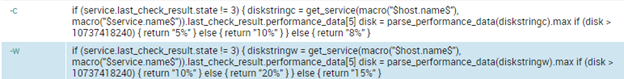
# If the last state is unknown I will set a hardcoded threshold (15%)
if (service.last_check_result.state != 3) {
    diskstringw = get_service(macro("$host.name$"), macro("$service.name$")).last_check_result.performance_data[5]
    disk = parse_performance_data(diskstringw).max
# Value > 10GB
    if (disk > 10737418240) {
        return "10%"
    } else {
        return "20%"
    }
} else {
    return "15%"
}
The Final Result:
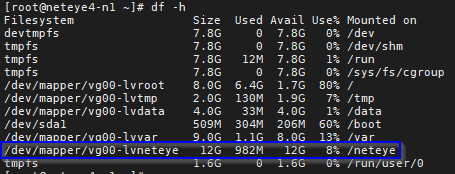
Since the partition in this example is 12GB, the command should apply the lowest thresholds: 5% for critical and 10% for warning:
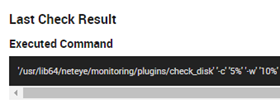
We can check this using the “Inspect” link from the monitoring view:
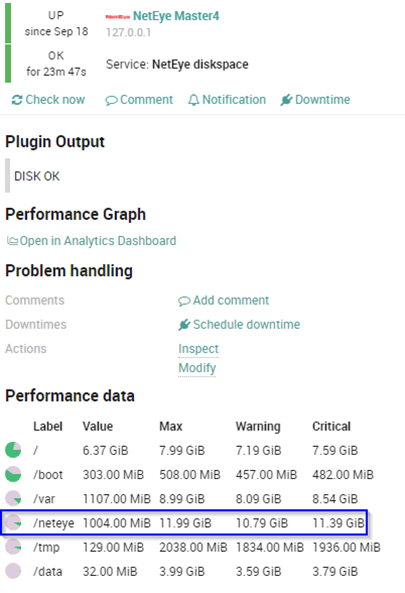
And finally we can check that everything is correct in the monitoring output and Performance data:
Conclusion
In summary, using Icinga DSL to compute thresholds or variables is a very powerful solution to make our monitoring systems intelligent. (Almost) like a human.

Stefano Bruno
Consultant at Würth Phoenix
Dear all, I'm Stefano and I was born in Milano.
Since I was a little boy I've always been fascinated by the IT world. My first approach was with a 286 laptop with a 16 color graphic adapter (the early '90s).
Before joining Würth Phoenix as SI consultant, I worked first as IT Consultant, and then for several years as Infrastructure Project Manager, with a strong knowledge in the global IT scenarios: Datacenter consolidation/migration, VMware, monitoring systems, disaster recovery, backup system.
My various ITIL and TOGAF certification allowed me to be able to cooperate in the writing of many ITSM Processes.
I like to play guitar, soccer and cycling, but... my very passion are my 3 baby and my lovely wife that has always encouraged me and helped me to realize my dreams.
Author
Latest posts by Stefano Bruno
13. 07. 2020
NetEye, Service Management, SLM, Unified Monitoring
ITSM Ticketing Integration with NetEye