Store Years of NetFlow Historical Data with Elastic Rollup on NetEye 4.9
Keeping historical data around for analysis is extremely useful but often avoided due to the financial cost of archiving massive amounts of data. Retention periods are thus driven by financial realities rather than by the usefulness of extensive historical data.
The Elastic Stack data rollup features provide a means to summarize and store historical data so that it can still be used for analysis, but at a fraction of the storage cost of raw data.
How Does it Work?
A rollup job is a periodic task that aggregates data from indices specified by an index pattern and rolls it into a new index. Essentially, you pick all the fields that you are interested in for future analysis, and a new index is created with just that rolled up data. In this way, Rollup indices can store months or years of historical data for use in visualizations and reports.
The following are requirements for using these features on NetEye:
- The NetEye SIEM (
neteye-siem) module must be installed - Event data should be aggregable with the same metrics (e.g.,
sum,count, andaverage)
NetFlow data is an example of a source that could be aggregated with this feature, since NetFlow generators typically send a lot of events and their usefulness lasts just a few weeks. After this time has elapsed, it may still be useful to have some of the metrics about that traffic (the total bytes transferred, etc.) or else summarized data.
Let’s Go!
First of all, it’s better to move the NetFlow data source we want to roll up to a specific index pattern in order to make field mappings consistent. In our case, we used the pattern filebeat-netflow-*.
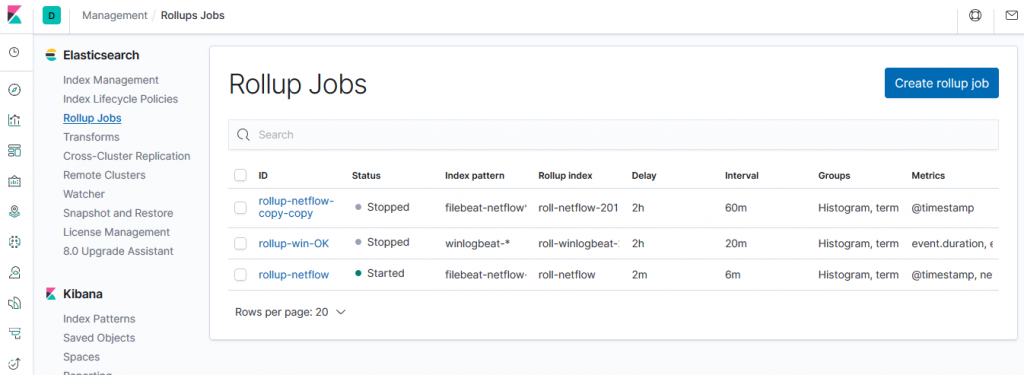
To create a Rollup Job you can go to the Management module under Log Analytics on NetEye:

Here you will need to fill in the following five fields:
1) Logistics: The two main fields to fill in are the index pattern you want to roll and the rollup index name (which must not match the index pattern). In our case the pattern is filebeat-netflow-* and the rollup index name is rollup-filebeat-netflow.
2) Date Histogram: Here you have to choose your date field and its relative bucket size, which means the interval of time buckets generated when rolling up. For example, 60m produces 60 minute (hourly) rollups.
It is very important to choose the correct time bucket in order to optimize space usage, but you also need to pay attention here because a bucket size that is too large corresponds to results with coarser granularity.
3) Terms: The terms section can only be used for keyword or numeric fields, and allow bucketing via each term’s aggregation when you create a visualization from the rollup index.
ATTENTION: While it is unlikely that a rollup will ever be larger in size than the raw data, defining term groups on multiple high-cardinality fields can effectively reduce the compression of a rollup to a large extent. Use this very carefully!
4) Histogram: In this section, we select one or more numeric fields to aggregate into numeric histogram intervals. Just as a note, the interval value is related to the Time bucket size set up in the Data Historigram section.
5) Metrics: You can choose numeric fields to collect metrics on. At least one metric must be configured. Acceptable metrics are min, max, sum, avg, and value_count.
Save, and game over!
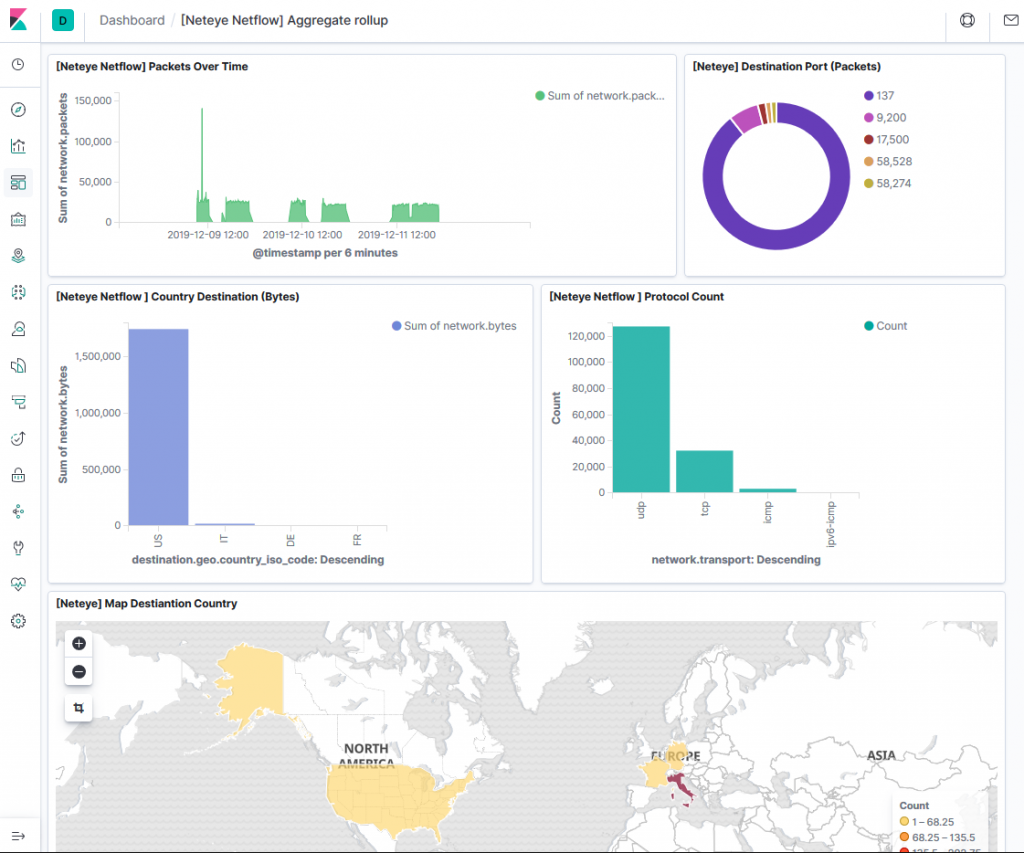
To see the results we only need to create a Rollup index pattern and a populated dashboard with rollup events. The result will be similar to the screen shown here:

| Pros | Cons |
| Reduces disk space used (useful for heavy and verbose log sources) | Rollup stores historical data at reduced granularity (cannot drill down on event fields) |
| Possibility to merge “live” and “rolled” data (on a search query) | Only ONE rollup index can be used (for search/visualization) |
| Advanced features are not supported, such as TSVB, Timelion, and Machine Learning |


