


31. 03. 2025
NetEye, Service Management

17. 04. 2019
Tobias Goller
NetEye, Predictive Analysis, Unified Monitoring
MSSQL Performance Monitoring: The Sequel
Due to the very positive customer feedback on our extended MSSQL performance monitoring article, I would like to briefly highlight this functionality.
We have been implementing systems for MSSQL performance monitoring for a long time, offered either as a managed IT service, or on-premise depending on the requirements.
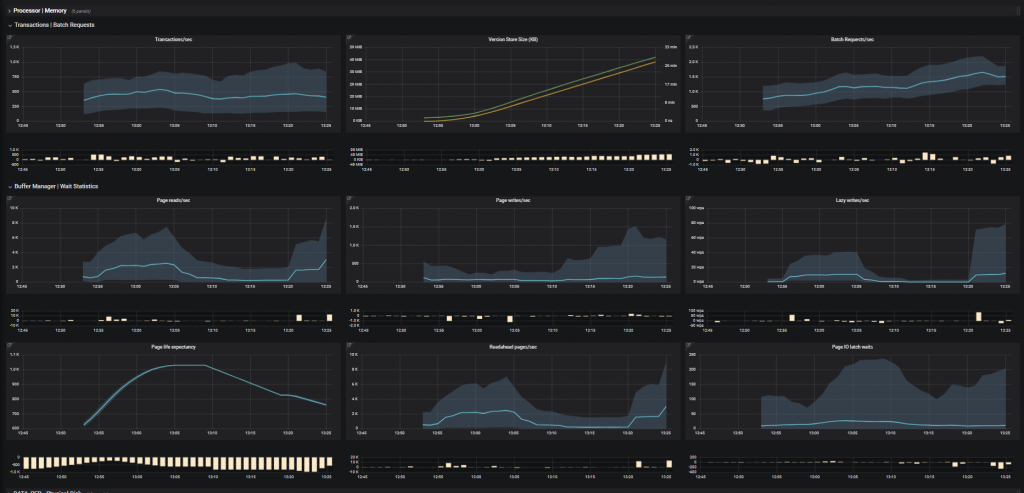
Previously, we recorded and evaluated counters such as CPU, memory KPI’s, I/O KPIs, performance counters, wait statistics, memory breakdowns, transaction log activity, etc. We would then frame them as a historical comparison for each counter individually.
Here’s a dashboard that illustrates what I mean:
Now let’s go one step further.
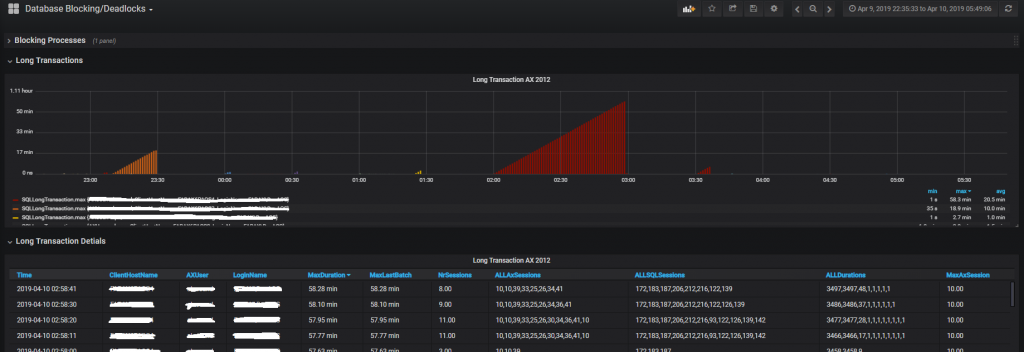
It’s clear that as soon as performance problems occur on a MSSQL database, these metrics are no longer sufficient for accurate error analysis. That’s why we’ve extended MSSQL performance monitoring to analyze long transactions, head blockers and deadlocks.
This means that we not only measure the number or duration, e.g. of long transactions, but also the user, host name, etc. from which each transaction was generated. This is an essential part of an effective performance analysis by a DBA.
Here’s a screenshot showing an example Long Transactions analysis:
To implement this functionality, we again use InfluxDB with Grafana dashboarding. We fill the Influx database via the Telegraf agent, which runs on the MSSQL server and reads the necessary information from the MSSQL instance via the scripts we have created.

Tobias Goller
NetEye Solution Architect at Würth Phoenix
I started my professional career as a system administrator.
Over the years, my area of responsibility changed from administrative work to the architectural planning of systems.
During my activities at Würth Phoenix, the focus of my area of responsibility changed to the installation and consulting of the IT system management solution WÜRTHPHOENIX NetEye.
In the meantime, I take care of the implementation and planning of customer projects in the area of our unified monitoring solution.
Author
Latest posts by Tobias Goller
16. 04. 2025
NetEye, Unified Monitoring
Application Performance Monitoring in NetEye with Elastic APM and OpenTelemetry
25. 10. 2024
Log-SIEM
Enhancing Cybersecurity with Elastic Defend: A Technical Consultant’s Perspective
28. 08. 2024
Unified Monitoring
ntopng Updates