


26. 03. 2025
Development, NetEye

25. 09. 2018
Gianluca Piccolo
Log Management, Log-SIEM, NetEye
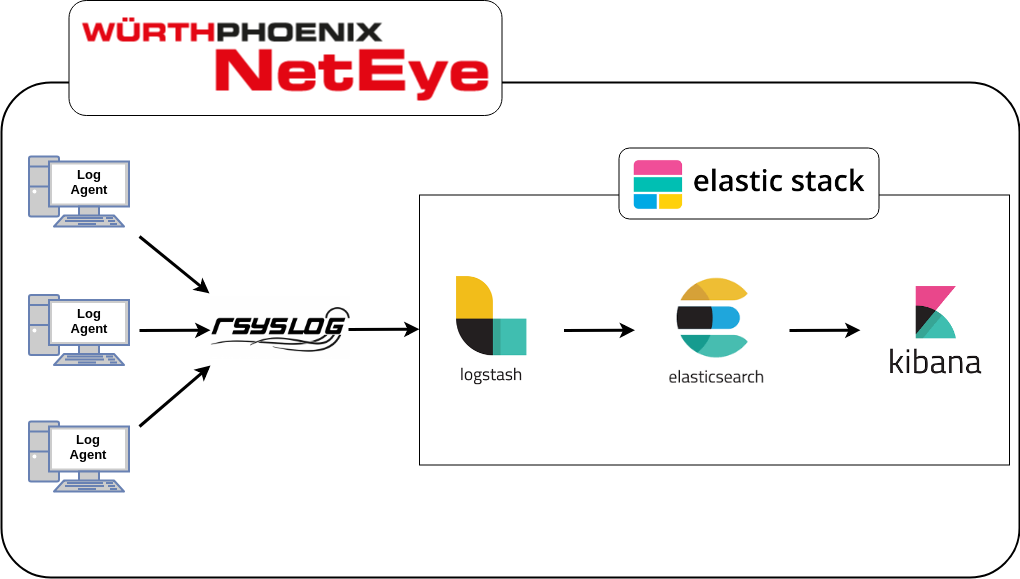
NetEye 4 Log Management: Rsyslog and the Elastic Stack
When you need to manage and collect large amounts of data, there can be a lot of hard tasks to do. So we decided to take some of the best Open Source tools to help us do it in the best possible way. Let me introduce you to Rsyslog and the Elastic Stack implementation for NetEye 4 Log Management.
Rsyslog (Version 8)
As the official website says, Rsyslog is the rocket-fast system for log processing. It manages huge amounts of incoming log data, pre-processes it, and delivers it to local destinations at a rate of over one million messages per second.
The version we decided to adopt is version 8, the latest stable release. The main features for this version are:
- Multi-threading
- TCP, SSL, TLS, and RELP ready
- Whole syslog message filtering
- A fully configurable output format
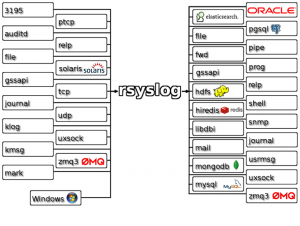
We use it to collect data from multiple agents, and we configured it to write the logs into the file system. The configuration includes the rules to allow the agents to send log messages to the Rsyslog service, along with the directives to write the log files into the file system.
The rules for the agents are written in a fully automated way by the Icinga Web 2 Log Manager module, but they are placed in a conf.d/ directory so that when the Rsyslog service is started, manual configuration files can also be loaded by placing them in that same folder (/neteye/shared/rsyslog/conf/rsyslog.d).
The Elastic Stack (Version 6)
Built on an open source foundation, the Elastic Stack lets you reliably and securely take data from any source, in any format, and search, analyze, and visualize it in real time. It is made of three main products: Elasticsearch, Logstash and Kibana.
Logstash
Logstash is a server-side data processing pipeline that ingests data from many different sources and delivers it to a data storage (“stash”).
We use it to read the log files written by Rsyslog in real time and to send the content to Elasticsearch.
Elasticsearch
Elasticsearch is a distributed, RESTful search and analytics engine. It is the heart of the Elastic Stack and the core of the NetEye 4 log storage system.
Kibana
Kibana is a render engine for Elasticsearch data. It allows you to visualize and understand large amounts of data by aggregating them logically and graphically.
We created filters to tell it what data to organize for rendering graphs and charts.

Full Stack Developer at Wuerth Phoenix. I love questioning myself, find new challenges to learn and new adventures to grow up. PHP lover trying to expand my skills studying new languages and tools to improve my professional life.
Author
Latest posts by Gianluca Piccolo
12. 11. 2024
Bug Fixes
NetEye 4 – Security Advisory
31. 07. 2024
ctf-writeups
CTF Exploit: Not A Democratic Election