Grafana is an open source dashboard tool that helps users to easily create and edit dashboards. Grafana uses Golang as a backend and Angular as the frontend. It’s quite a large codebase and supports a large number of options for its components (data sources, options, panels, etc.). Grafana’s stylesheet is written using the Sass CSS extension language. This preprocessor can help you customize themes.
All Sass files are located in the public/sass folder.
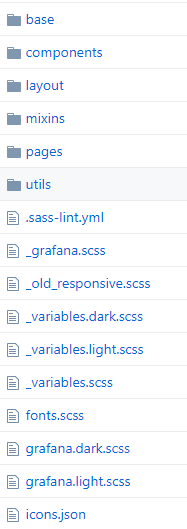
The base folder contains some generic files like font, icons, etc. In the component folder you can find stylesheets for all the HTML components such as buttons, navbars, searchbars, tabs and more. All the rules that manage page structure and layout parameters can be found in the layout directory. The mixins directory is self-explanatory: it contains all patterns of property-value pairs, which other rule sets can then reuse. In the pages directory you can find page-dedicated files, for example styles for the dashboard, for the error page, the login page and so on. The utils directory contains declarations such as spacing, width, etc.
As you can see from the screenshot of the main Sass folder, there are also generic files that manage themes and the Sass compiler itself.
If you need to change some style characteristics on your Grafana interface, you just need to customize one of the Sass files and then recompile the theme.
Interface customization is a rather easy operation. Let’s suppose we want to use a corporate color theme in our Grafana dashboard. The steps are:
0 – Install Grafana
If you haven’t done it yet, I suggest that you install Grafana on your machine by following the guide here: Building Grafana from source. This way you’ll automatically install Node.js and the Sass compiler Yarn.
1 – Start from the existing theme you like the most
If you want to change the default Grafana colors to red and black, it’s both simplest and fastest to change the colors inside the _variables.dark.scss file. Changing the values for the color variables in this file means they will be changed throughout the interface when using the dark theme.
For example, we can change the background color from:
$dark-2: #1f1d1d;
to
$dark-2: #1e1e1e;
And add a new red color for titles:
$custom-red: #cc0000;
2 – Change the style
If you want to change more than just colors, you can customize other .sass files. For instance, if I want to change the color of the dashboard title, I can change the settings in the _dashboard.sass file:
.dashboard-header {
color: $custom-red;
font-family: $headings-font-family;
font-size: $font-size-h3;
text-align: center;
span {
display: inline-block;
@include brand-bottom-border();
padding: 0.5rem .5rem .2rem .5rem;
}
}
3 – Compile the Grafana frontend
Once you’ve finished your style customization, you just need to launch the frontend build process using the following command:
npm run build
An updated Grafana theme will then be generated inside the public_gen/css/ folder, and after refreshing the page in the browser, you’re done!


Hi Valtenina, thank you for that article!
Maybe you are also interested in a “small” solution a guy found here:
https://community.openhab.org/t/matrix-theme-for-habpanel/31100/22
Of course you are an expert and I think with your solution you can do much more, but for me as a “grafana newbie” and non-professional user, it’s an easy way to change background color for example, without building the frontend new after a change.
hello valentina, please could you say me where is the package.json for the dark theme?
I followed
http://www.neteye-blog.com/2017/12/how-to-customize-your-grafana-theme/
and Im lost when I ran:
npm run build
Due the package.json is missed in the SASS files directory
It is required to run it, isnt?
tia.
Hi Raul,
There is only one package.json file and you can find it into the grafana/package.json path.
I wrote this guide while working with the previous version of Grafana. If you are using the new release (5.x.x) the building procedure has changed.
The new frontend-building procedure requires nodejs (v.6+). For building it from source you have to run the following commands:
npm install -g yarn

yarn install --pure-lockfile

yarn watch
For further information you can refer to the official documentation (Grafana Doc).
I hope it helps! 🙂
Hi Valentina,
Thanks for your work.
Just one question about this customization method. We just installed a grafana for our needs and i discover the app actualy.
What about grafana upgrades ? Does it overwrite our sass modifications or do we have any solution to create a selectable custom theme ?
Hi Nicolas,
Yes for sure and update can destroy your work. I suggest you to use a VCS in order to not loose your customization and during the upgrade procedure carefully merge your changes.
Hello,
I have a short question.
Can I customize and recompile if I installed Grafana normally on Linux?
Or must it build from source before?
Thanks!
Hello,
For theme customization you need to build Grafana from source. If you have a running Grafana installation, you can also create a “Grafana development” environment where you can customize the theme and then build the frontend from source. Once you get the compiled theme directory, you can import it in your production environment.
Hi Valentina,
Thanks for your work.
Actually I had a different query. I am actually trying to build an application entirely from the login page and signup and after getting into the application I want to add a particular dashboard which would have specific panel plugins and datasource. But what I want to achieve is not login into Grafana but have my own login and own look and feel.
Could you help me with this?
Hi Manoj,
This is exactly what I was working on when I wrote this blog! 🙂
It’s hard to give a single answer to your question, without knowing more details on the system you are working on. Anyway I will be for sure happy to help you and answer to your more detailed questions. 😉
An alternative to modify some CSS settings is the Grafana plugin “Boom Theme Panel” (https://grafana.com/grafana/plugins/yesoreyeram-boomtheme-panel).
It allows you to define a background image or to override the background color under “Custom Style / CSS Override” with the following settings:
.main-view {
background-color: #000000;
}
Hi,
Have you tried the boom-theme plugin in Grafana 7.x by any chance.
I used it in Grafana v6.2 last year and it worked as expected but now on Grafana 7.4 (latest), even though the theme I created applied, the issue I am having is on ‘Transparent’ , display panel without background. When I toggle the Transparent switch on/off it makes no difference while the same them works in previous versions 6.x
Any idea?
Thanks.
Hi Paul,
No, I haven’t tried this plugin yet. I am still working on Grafana theme customization starting from scratch and rebuilding the Grafana frontend because we need deep customization of colors but also components.
Sorry for not being able to help you.
Hi Valentina,
Thanks for your tips about grafana.
I have got 2 questions –
1 – how do we change the logo? – where is the location
2 – I supposed you are an expert – may i know from your experience – is Grafana stable and robust?
Many thanks
Francis from Singapore
Hi Francis,
Thanks for your questions and sorry for the late answer.
1. You can find the images and logos in `/public/img/`
2. I would definitely say yes! We have been using Grafana for many years, and we are still satisfied with its potential and stability.
Hi,
I am a private user and I am making a website where I want to show some custom dials and a feed back action button which posts a form. Here are my question if you can please answer
1: How can I white label the non enerprise version , is this allowed ?
2: How can send a web request, web hook etc without requiring a seperate login other than the sso I would implement on the grafana service ?
thanks
Amrit
Hi Amrit,
Thanks for your questions.
1. I will suggest to have a look at this discussion about the white labeling of the product Replace logo in UI, but I will also suggest that the enterprise version has a dedicated option for this Grafana Enterprise: white-labling
2. For giving you significant answer on this I should know more about your use-case and environment, but maybe try to have a look at the Grafana API token