SAP Monitoring: A Journey to Comprehensive Visibility on NetEye – Part 1
Monitoring SAP systems has always been a major hurdle in every job I’ve held. SAP has its own monitoring tools, primarily CCMS, but extracting metrics and configurations from the SAP world has always been a challenge. In the past, I used SNMP traps configured in CCMS to send alerts when thresholds were exceeded. However, this process was time-consuming, CCMS isn’t easy to configure, and since it’s passive monitoring, I didn’t get any metrics.
When I joined Würth-Phoenix, one of my first tasks was onboarding a client who used only SAP monitoring with a HANA database. Thanks to collaboration with our partner Derga Consulting, and invaluable advice from our colleague Andreas Forster, we finally managed to get metrics out of SAP and integrate them into our NetEye monitoring system’s cloud platform. This allowed us to achieve comprehensive infrastructure monitoring, from the operating system to the innermost SAP components.
Below, I’ll explain what we did, and the potential of this work.
A Two-Pronged Approach to SAP Monitoring
We developed two complementary solutions for monitoring SAP instances. The first uses a Bash script plugin that launches the sapcontrol command-line interface. This allows us to manage SAP at the operating system level and, thanks to SOAP web services, visualize some SAP system metrics.
The second solution leverages the check_sap_health plugin developed by Consol Labs ( https://labs.consol.de/de/omd/packages/check_sap_health/ ), which we modified to achieve our goals.
Diving Deeper: Leveraging sapcontrol for SAP Monitoring
As mentioned earlier, our plugin harnesses the power of SAP’s sapcontrol command (refer to the official documentation here).
sapcontrol utilizes Access Control Lists (ACLs) for enhanced security. In our setup, only the local SAP server, any Application Servers (AS), and the NetEye satellite are granted read access to the data. This is achieved by creating the $(DIR_PROFILE)$(DIR_SEP)service_http(s).acl files and defining the access rules as follows:
permit  127.0.0.1/32                                        # permit localhost
permit  <IP address of 1st SAP-Server>/32     # permit local server 1
permit  <IP address of 2nd SAP-Server>/32    # permit local server 2
# (similar add all SAP-Applicationservers of the system)
permit <IP-address of Neteye/32     # permit NetEye server
deny    0.0.0.0/0                                               # deny the rest
By implementing these ACLs, we ensure that only authorized systems can access sensitive SAP data via sapcontrol, maintaining a high level of security within our monitoring infrastructure.
While sapcontrol offers a wealth of information, we might not need all of it for our monitoring purposes. This is where the DEFAULT.PFL file comes into play. This file allows us to filter and select only the specific methods we want to read from sapcontrol.
Here’s how we modified DEFAULT.PFL to achieve this:
service/protectedwebmethods = SDEFAULT -GetVersionInfo -GetAlertTree -GetAlerts -EnqGetStatistic -GetQueueStatistic -GetInstanceProperties -GetSystemInstanceList -ReadLogFile -ListLogFiles -AnalyseLogFiles -ABAPReadSyslog -ABAPGetComponentListref.: https://help.sap.com/docs/SUPPORT_CONTENT/si/3362959700.html
By specifying the desired methods in DEFAULT.PFL, we optimize our monitoring process.
Unveiling the SAP Monitoring Plugin: Key Functions
Our NetEye plugin utilizes various functions to monitor your SAP instances effectively. Here are some of the key functions:
GetProcessList: Unveiling Active Processes
The GetProcessList function provides a detailed list of active processes running within your SAP instance. This list varies depending on the type of instance you’re monitoring.
For example:
ASCS Instance:
GetProcessList OK name, description, dispstatus, textstatus, starttime, elapsedtime, pid msg_server,
MessageServer, GREEN, Running, 2024 12 05 13:17:48, 26:34:15, 12259
enq_server, Enqueue Server 2, GREEN, Running, 2024 12 05 13:17:48, 26:34:15, 12260
Dialog Instance:
GetProcessList OK name, description, dispstatus, textstatus, starttime, elapsedtime, pid
disp+work, Dispatcher, GREEN, Running, 2024 12 03 13:38:58, 74:14:56, 27568
igswd_mt, IGS Watchdog, GREEN, Running, 2024 12 03 13:38:58, 74:14:56, 27569
gwrd, Gateway, GREEN, Running, 2024 12 03 13:38:59, 74:14:55, 27589
icman, ICM, GREEN, Running, 2024 12 03 13:38:59, 74:14:55, 27590
This function provides valuable insights into the health and performance of your SAP system by:
- Identifying running processes: You get a clear view of all active processes, ensuring critical components are operational
- Monitoring process status: The output includes status indicators (e.g., “GREEN,” “Running”) allowing you to quickly identify any issues
- Tracking process uptime: By monitoring the
starttimeandelapsedtime, you can track how long processes have been running and identify potential resource bottlenecks
This is just one of the many functions the NetEye plugin uses to provide comprehensive SAP monitoring. In the next sections, we’ll explore other essential functions and how they contribute to a robust monitoring strategy.
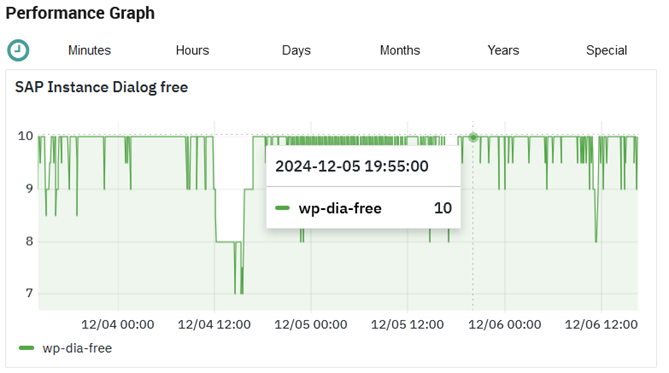
Analyzing Work Processes with ABAPGetWPTable
Another powerful function in the NetEye plugin is ABAPGetWPTable. This function analyzes the Work Process Table within your SAP system, providing valuable insights into workload distribution and resource utilization.
Here’s an example of the output generated by ABAPGetWPTable:
OK: Number of free dialog processes: 10 of 10
Current Workprocess-Table: No, Typ, Pid, Status, Reason, Start, Err, Sem, Cpu, Time, Program, Client, User, Action, Table
0, DIA, 27591, Wait, , yes, , , 0:08:33, , , , , ,
1, DIA, 27592, Wait, , yes, , , 0:08:50, , , , , ,
2, DIA, 27593, Wait, , yes, , , 0:09:50, , , , , ,
3, DIA, 27594, Wait, , yes, , , 0:07:54, , , , , ,
4, DIA, 27595, Wait, , yes, , , 0:14:38, , , , , ,
5, DIA, 27596, Wait, , yes, , , 0:16:31, , , , , ,
6, DIA, 27597, Wait, , yes, , , 0:14:13, , , , , ,
7, DIA, 27598, Wait, , yes, , , 0:19:06, , , , , ,
8, DIA, 27599, Wait, , yes, , , 0:18:09, , , , , ,
9, DIA, 27600, Wait, , yes, , , 0:18:25, , , , , ,
10, BTC, 27601, Wait, , yes, , , 0:01:22, , , , , ,
11, BTC, 27602, Wait, , yes, , , 0:00:57, , , , , ,
12, BTC, 27603, Wait, , yes, , , 0:05:44, , , , , ,
13, UPD, 19741, Wait, , yes, , , 0:00:02, , , , , ,
20, UPD, 27611, Wait, , yes, , , 0:00:10, , , , , ,
21, BTC, 27612, Wait, , yes, , , 0:00:59, , , , , ,
22, BTC, 27613, Stop, TI, yes, , , 0:00:55, 3, FDC_START_TIMERDAEMON, 500, SAP_SYSTEM, ,
23, BTC, 27614, Wait, , yes, , , 0:01:42, , , , , ,
24, BTC, 27615, Wait, , yes, , , 0:01:48, , , , , ,
25, BTC, 27616, Wait, , yes, , , 0:02:03, , , , , ,
26, BTC, 27617, Wait, , yes, , , 0:02:13, , , , , ,
27, BTC, 27618, Wait, , yes, , , 0:09:20, , , , , ,
28, BTC, 27619, Wait, , yes, , , 0:04:46, , , , , ,
29, BTC, 27620, Wait, , yes, , , 0:08:52, , , , , ,
30, BTC, 27621, Wait, , yes, , , 0:04:26, , , , , ,
31, SPO, 27622, Wait, , yes, , , 0:00:16, , , , , ,
32, UP2, 27623, Wait, , yes, , , 0:00:06, , , , , ,

This output offers a comprehensive overview of your SAP system’s work processes, including:
- Process Type: Identify the different types of work processes (e.g., dialog, background, update, enqueue) and their current status
- Availability: Determine the number of available and occupied work processes, helping you assess system capacity and potential bottlenecks
- Response Time: Analyze the response times of different work processes to identify performance issues and optimize resource allocation
- Workload Distribution: Understand how work is distributed across different instances and work processes, allowing for better load balancing and system optimization
By leveraging the ABAPGetWPTable function, you can gain a deeper understanding of your SAP system’s internal workings and can proactively address potential performance issues before they impact your business operations.
Keeping an Eye on the Queue: GetQueueStatistic
To effectively monitor the health and performance of your SAP system, it’s crucial to keep a close eye on the dispatcher queue. This is where user requests are processed, and any bottlenecks here can significantly impact system responsiveness.
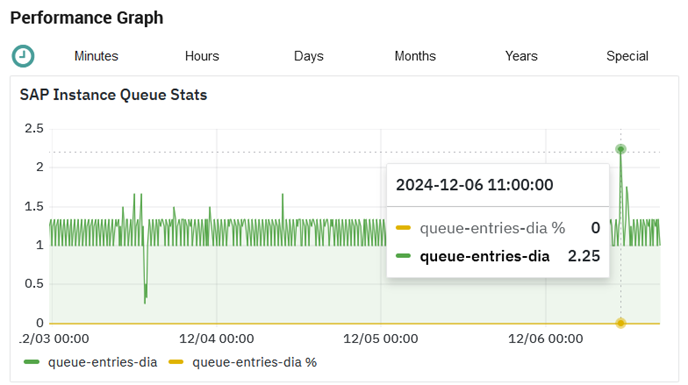
The NetEye plugin utilizes the GetQueueStatistic function to retrieve essential information about the dispatcher queue. This function provides valuable data on the current state of the queue, including the number of requests waiting to be processed and historical peak values.
Here’s an example of the output generated by GetQueueStatistic:
OK: Requests in dialog-queue of dispatcher: 1 of 14000 (Peak since start of DP: 94)
Its output tells us:
- Current Queue Length: There is currently 1 request waiting in the dialog queue
- Queue Capacity: The maximum capacity of the dialog queue is 14000 requests
- Peak Queue Length: The highest number of requests in the queue since the dispatcher started is 94
By monitoring these metrics, you can:
- Identify potential bottlenecks: A consistently high number of requests in the queue may indicate a need for increased resources or system optimization
- Proactively address performance issues: By tracking the peak queue length, you can identify trends and take preemptive measures to prevent future bottlenecks
- Ensure optimal user experience: Keeping the queue length under control ensures that user requests are processed quickly, leading to a smooth and responsive SAP system
The GetQueueStatistic function is a valuable tool for maintaining the health and performance of your SAP environment. By integrating this function into your NetEye monitoring setup, you can gain valuable insights into your dispatcher queue and ensure optimal system performance.
Monitoring Lock Contention with EnqGetStatistic
In any SAP system, lock contention can be a major performance bottleneck. When multiple users or processes try to access the same resources simultaneously, locks are used to ensure data consistency. However, excessive lock contention can lead to delays and hinder system performance.
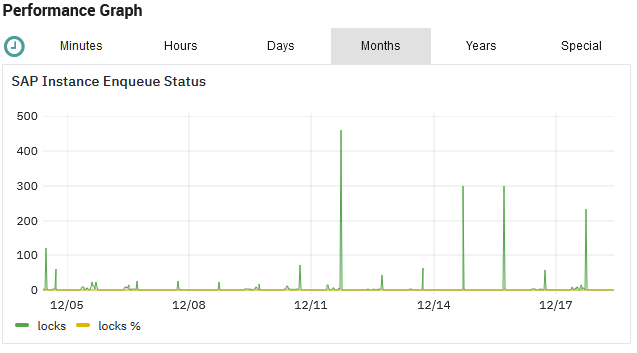
To monitor lock contention effectively, the NetEye plugin incorporates the EnqGetStatistic function. This function provides critical information about the lock table, including the current number of lock entries and the peak number of entries since the instance started.
Here’s an example of the output generated by EnqGetStatistic:
OK: Current entries in lock-table: 0 of 250000 (Peak since start of instance: 2286) 
This output reveals:
- Current Lock Entries: There are currently 0 entries in the lock table, indicating no active lock contention at this moment
- Lock Table Capacity: The maximum capacity of the lock table is 250,000 entries
- Peak Lock Entries: The highest number of entries in the lock table since the instance started is 2,286
By monitoring these metrics, you can:
- Identify lock contention issues: A consistently high number of lock entries can signal potential performance bottlenecks due to resource contention
- Analyze historical trends: Tracking the peak lock entries helps you understand the system’s lock usage patterns and identify potential areas for optimization
- Proactively address performance problems: By monitoring lock contention, you can take preemptive measures to minimize lock conflicts and ensure smooth system operation
The EnqGetStatistic function provides valuable insights into the lock contention within your SAP system. Integrating this function into your NetEye monitoring strategy helps you maintain optimal performance and prevent costly delays caused by lock conflicts.
Customizable Alerting: Tailoring Monitoring to Your Needs
A key advantage of all the plugins we’ve explored so far is their ability to customize alert thresholds. This means you can fine-tune the monitoring system to match your specific requirements and risk tolerance.
Instead of relying on generic, one-size-fits-all alerts, you can define thresholds that align with your SAP system’s unique characteristics and performance expectations. This allows you to:
- Reduce alert fatigue: By setting appropriate thresholds, you can minimize unnecessary alerts and focus on the most critical issues
- Prioritize critical events: You can configure alerts to escalate based on severity, ensuring that critical problems receive immediate attention
- Optimize resource allocation: Customizable alerts help you allocate your resources effectively by focusing on the most impactful issues.
This flexibility makes the NetEye plugin a powerful tool for proactive SAP monitoring. You can tailor the alerting system to your specific needs, ensuring that you’re always aware of potential problems before they impact your business operations.
Stay tuned for Part 2 of this blog, where we’ll dive into the check_sap_health plugin and explore its key functionalities.
These Solutions are Engineered by Humans
Did you find this article interesting? Does it match your skill set? Our customers often present us with problems that need customized solutions. In fact, we’re currently hiring for roles just like this and others here at Würth Phoenix.


