Elastic Universal Profiling – Profiling native code
In a previous post we went through the configuration of Elastic Universal Profiling in NetEye, seeing how we can profile applications written in programming languages that do not compile to native code (for example Python, PHP, Perl, etc.)
But what happens if the application is written for example in C, Go or Rust?
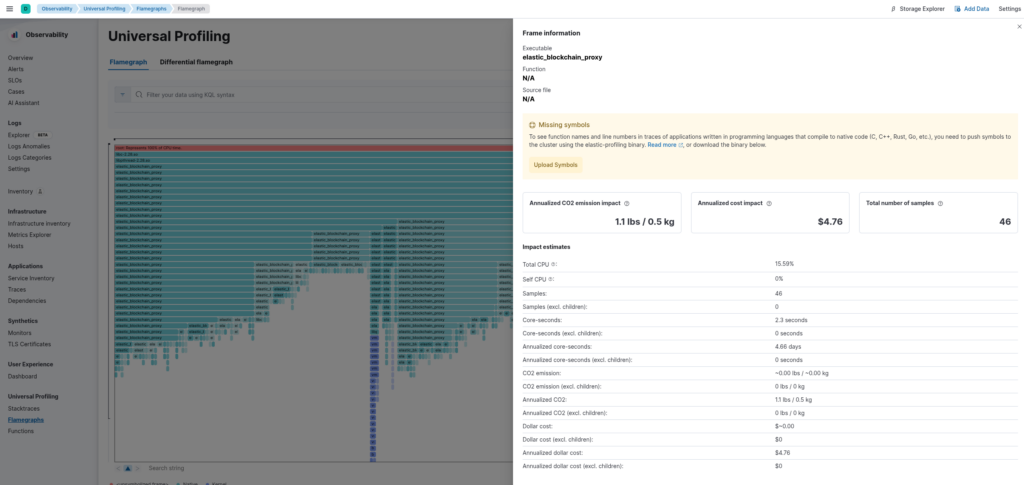
Let’s take a look at our test machine where a Rust application is running (namely the El Proxy verification).

In our Kibana Flamegraph we can actually see that the elastic_blockchain_proxy executable is running, along with how much CPU it’s consuming. This may already be useful to understand which applications on your servers are occupying the CPU, but it doesn’t let us understand exactly which functions in the executable are consuming the CPU, and so we cannot understand which parts of the applications need to be optimized most.
The reason why Kibana cannot report the function names is that the application is compiled to native code, which doesn’t contain that information.
To resolve this, Elastic allows you to upload symbols for native code which allows Kibana to provide you with function names and the line numbers of the code that’s using the CPU.
Configuring the Symbolizer Backend
To upload the symbols of your application, you first need to configure the Profiling Symbolizer backend, which will listen for upload requests and then upload the symbols to Elasticsearch.
There are various options to run the symbolizer backend (RPMs, helm charts, containers, etc.): in this blog post we’ll spawn a container on the NetEye Master which is very easy to manage.
First, we need to create an API Key for the Symbolizer as described here. You’ll need the base64 encoded key in the next step.
Then we create the configuration file /etc/Elastic/universal-profiling/pf-elastic-symbolizer.yml of the Symbolizer backend, which should be something similar to the following (substitute <my-neteye-fqdn> with your NetEye FQDN and <my-base64-encoded-api-key> with the API Key you just created):
pf-elastic-symbolizer:
  # Defines the host and port the server is listening on.
  host: "0.0.0.0:8240"

  # Enable secure communication between pf-host-agent and pf-elastic-collector.
  ssl:
    enabled: false


#================================ Outputs =================================

# Configure the output to use when sending the data collected by pf-elastic-collector.

#-------------------------- Elasticsearch output --------------------------
output.elasticsearch:
  # Array of hosts to connect to.
  # Scheme and port can be left out and will be set to the default (`http` and `9200`).
  # In case you specify and additional path, the scheme is required: `http://localhost:9200/path`.
  # IPv6 addresses should always be defined as: `https://[2001:db8::1]:9200`.
  hosts: ["<my-neteye-fqdn>:9200"]

  # Protocol - either `http` (default) or `https`.
  protocol: "https"

  # Authentication credentials - either API key or username/password.
  api_key: "<my-base64-encoded-api-key>"
Note that for production environments you should enable secure communication by setting
ssl.enabled: trueand generate the corresponding certificates.
You can now run the symbolizer backend by simply running:
podman run -d --name pf-elastic-symbolizer -p 8240:8240 -v /etc/Elastic/universal-profiling/pf-elastic-symbolizer.yml:/pf-elastic-symbolizer.yml:ro docker.elastic.co/observability/profiling-symbolizer:8.16.2 -c /pf-elastic-symbolizer.ymlTo ensure external machines can upload symbols, you should open the firewalld port of NetEye with:
firewall-cmd --add-port=8260/tcpNow your symbolizer backend is ready to receive symbols from your native code applications.
Uploading Your Native Code Application
Uploading the symbols of a native application is an operation that you currently need to perform manually, and that you will need to do once for each executable that you want to profile. For example if a single application is deployed to a set of N machines, you’ll need to upload the symbols only one time. If a new version of the application is then deployed on those machines, you’ll need to re-upload the symbols to correctly visualize the updated profiling.
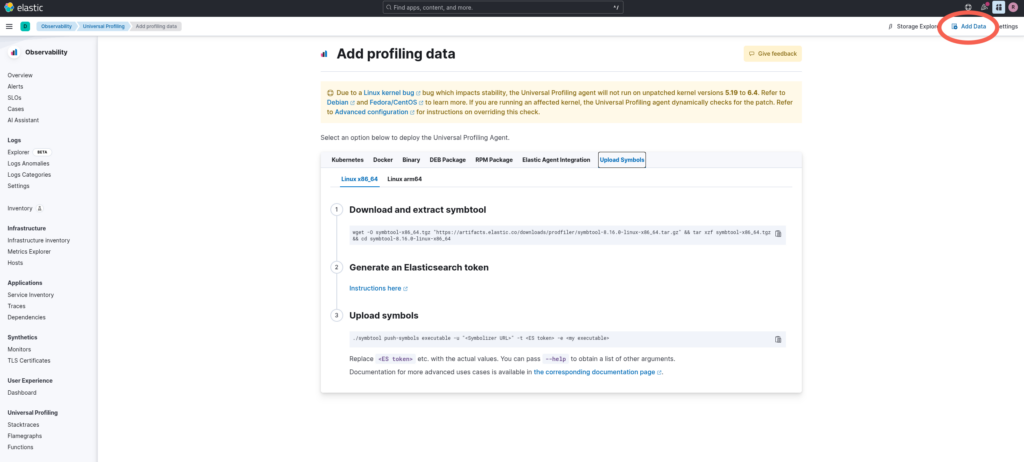
You can find instructions on how to upload symbols in the Kibana Universal Profiling view under Add data.

To upload symbols you need to have access to an executable containing the debug symbols (you can find more information here).
In our case, we wanted to profile the elastic_blockchain_proxy executable, which is written in Rust. Applications written in Rust contain debug symbols depending on the flags with which the application was compiled.
In this case the application was not compiled with debug enabled, but the executable still contains information on function names. If you don’t know whether the executable contains symbols or not, in my experience you can simply try to upload the symbols and see.
In any case you don’t necessarily need to deploy the executable with debug information inside, but you can deploy the executable without symbols, and deploy the symbols separately from the executable compiled with the correct flags, as described here.
So, in our case, I connected to the machine where the executable was running and simply executed:
wget -O symbtool-x86_64.tgz "https://artifacts.elastic.co/downloads/prodfiler/symbtool-8.16.0-linux-x86_64.tar.gz" && tar xzf symbtool-x86_64.tgz && cd symbtool-8.16.0-linux-x86_64
./symbtool push-symbols executable -u "http://<my-neteye-fqdn>:8240" -t "<my-base64-encoded-api-key>" -e /usr/bin/elastic_blockchain_proxy
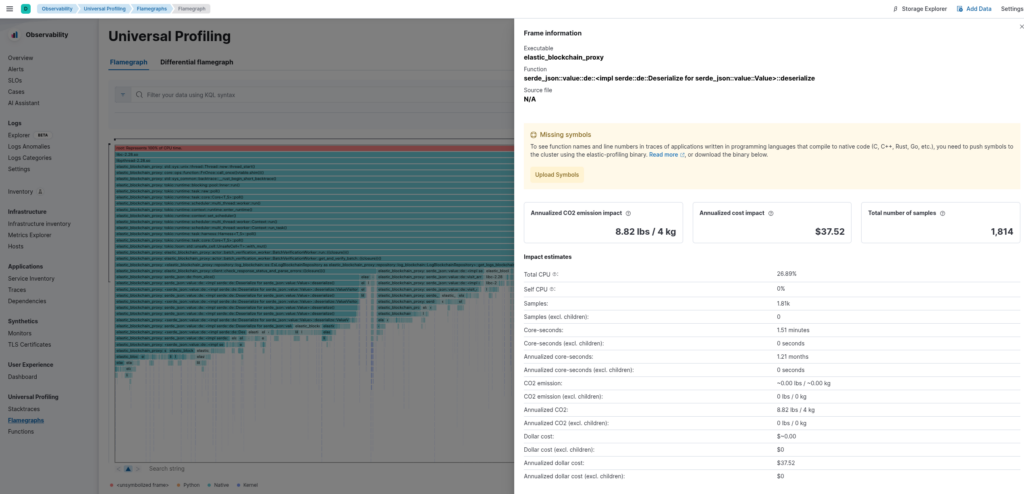
Now, going back to Kibana, we can see that magically the function names appear for our executable:

You might notice that we are still missing the source file and line numbers, but function names in my opinion are already enough to understand what’s consuming CPU time.
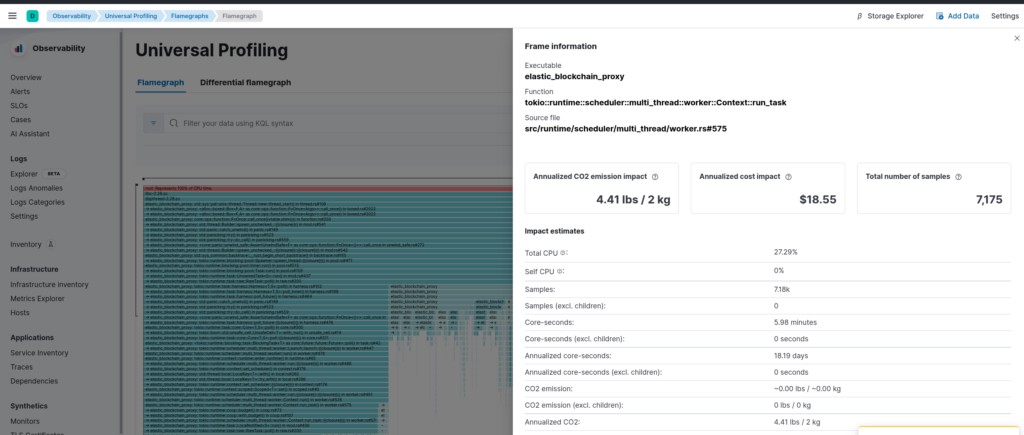
For the sake of completeness, after re-compiling the executable with cargo with the option debug = 1 as also suggested by the Elastic guidelines, we can also get the information regarding source file and line numbers:

These Solutions are Engineered by Humans
Did you find this article interesting? Does it match your skill set? Programming is at the heart of how we develop customized solutions. In fact, we’re currently hiring for roles just like this and others here at Würth Phoenix.


