How to Monitor the Reporting Scheduler
Automatically sending reports on a precise schedule is one of the great features of NetEye 4. It allows you to save a lot of time and effort when you need to periodically send reports to your customers. It doesn’t matter how many reports, how many customers, or how often, we’ve got you covered.
But as with everything else, the scheduler could break: it relies on multiple components, and the configuration might be modified so that it interrupts the correct behavior of the feature without anyone noticing…except the customers XD.
That’s why NetEye 4 – as a complete monitoring solution – allows you/us to monitor the Reporting scheduler itself, giving you/us the possibility to fix it as fast as possible if it’s not working properly.
Overview
This monitoring solution relies on multiple components within NetEye 4 itself: the Reporting module (an additional NetEye 4 module), the Tornado module and the Monitoring module (both belonging to the Core module).
First we need to create a testing purpose report in Reporting. Then we need to configure the Reporting schedule to send the report via email daily to a NetEye local email address. Tornado will catch that email and with a specific rule will trigger an action to set the appropriate monitoring service status to OK. The monitoring service is configured to become CRITICAL if it doesn’t receive an OK status for two consecutive days.

Reporting Configuration
Create a simple Host SLA report and configure it to be sent by email daily.
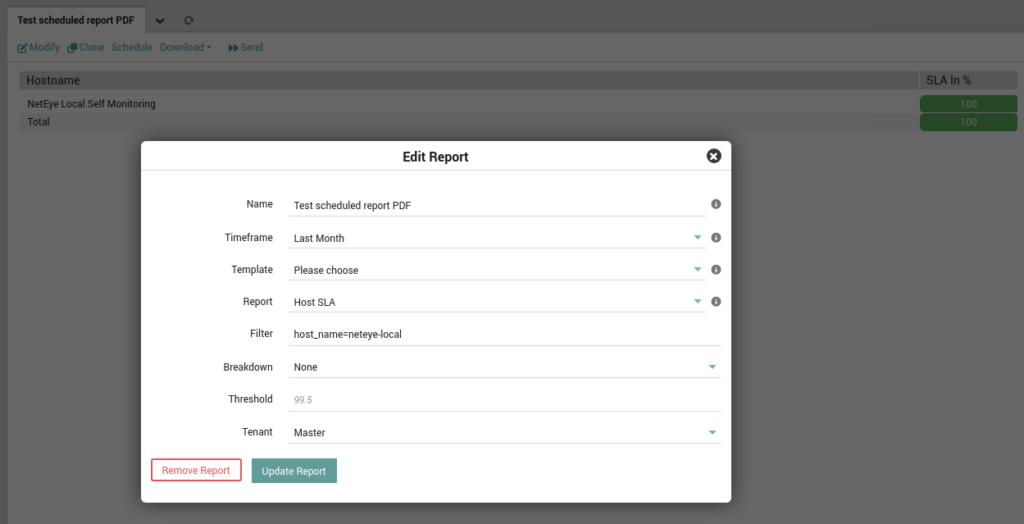
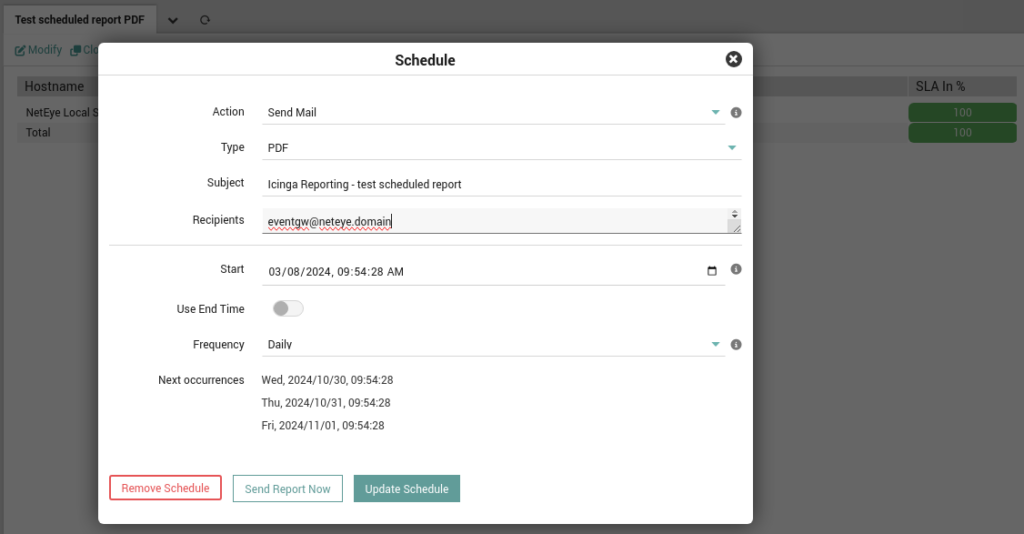
It’s important that the recipient is the local eventgw user. The scheduler must be able to send email to the NetEye server itself (it’s a sort of loopback).
Tornado Configuration
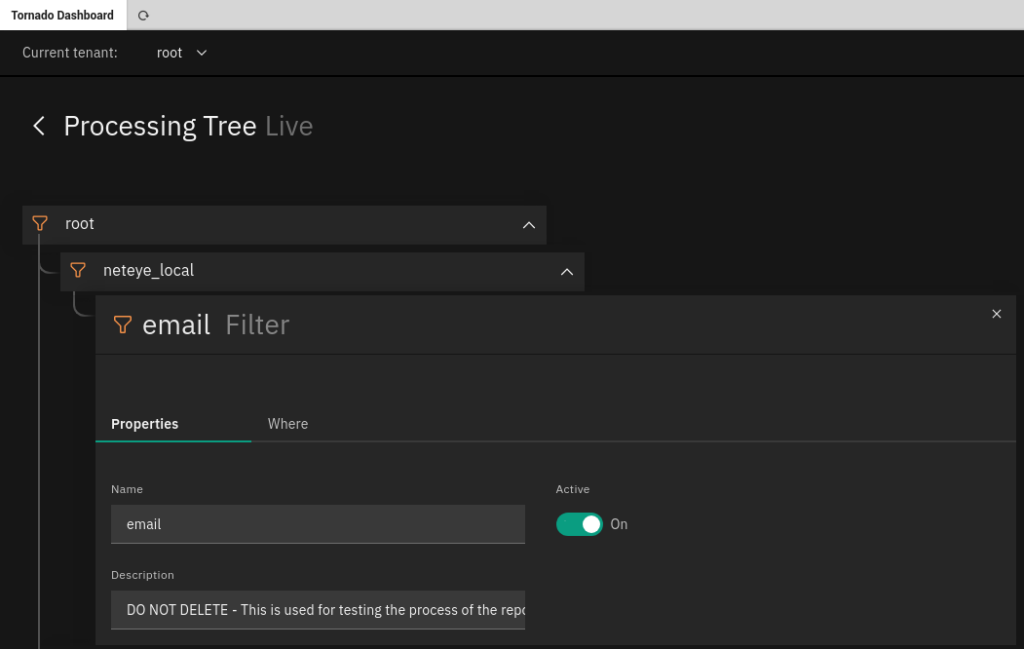
Now we need to configure the Tornado engine to intercept the emails with the subject line Icinga Reporting - test scheduled report to trigger a smart monitoring action.
The first thing is to create a filter under the root node to filter out every event of a type that’s not email.
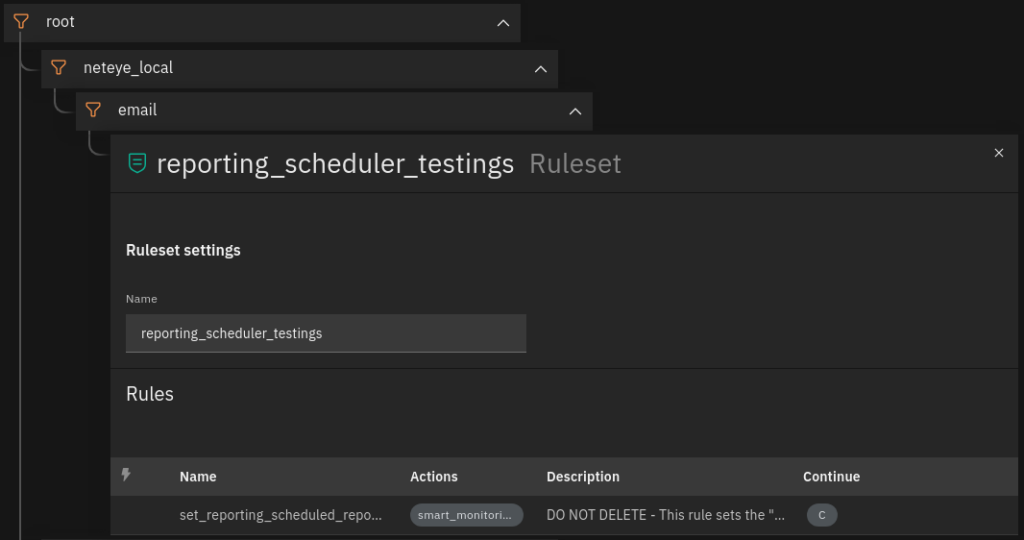
Then we can create a Ruleset that contains the rule that executes the smart monitoring action.
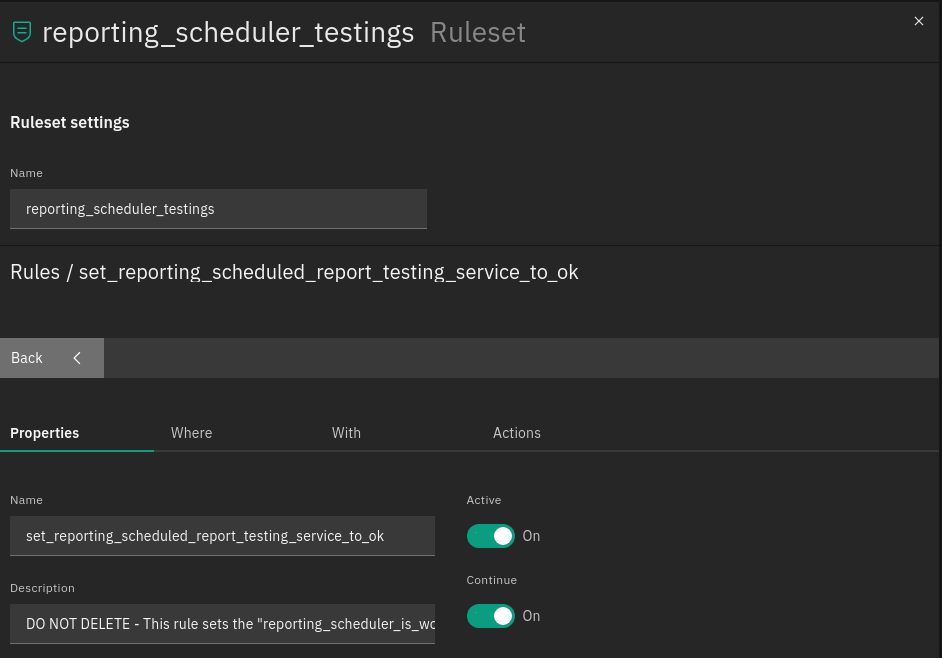
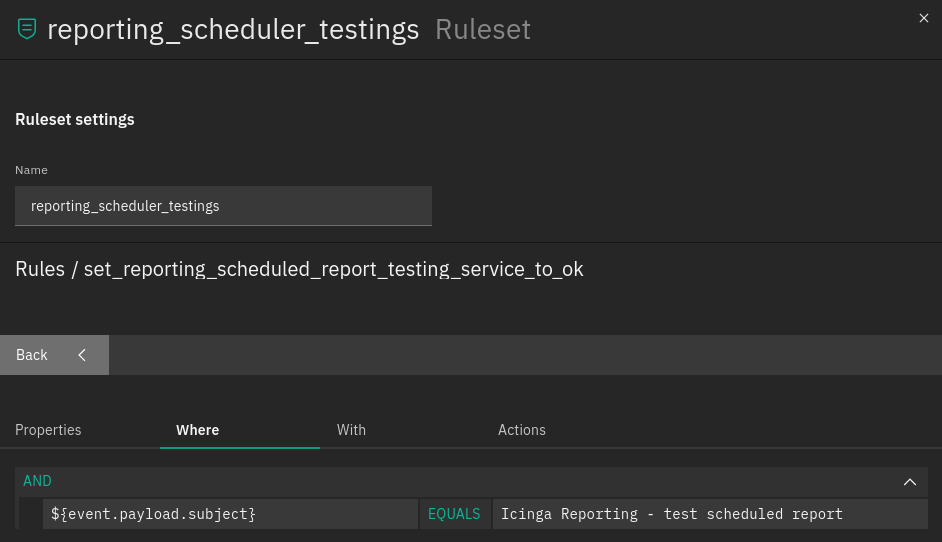
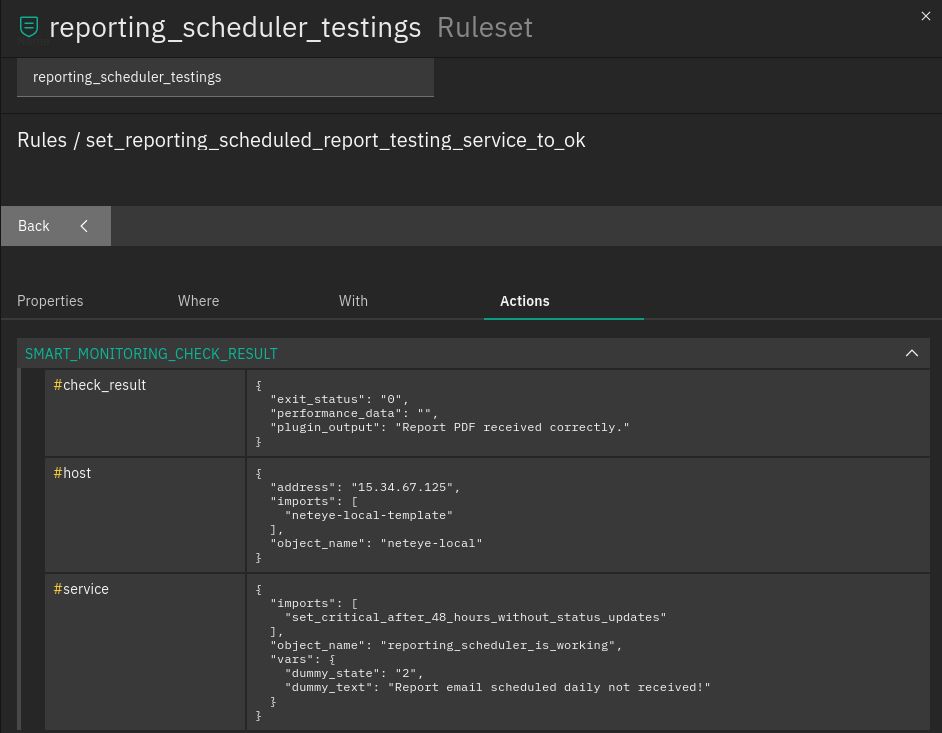
Deploy the draft to put the configuration into effect.
Monitoring Configuration
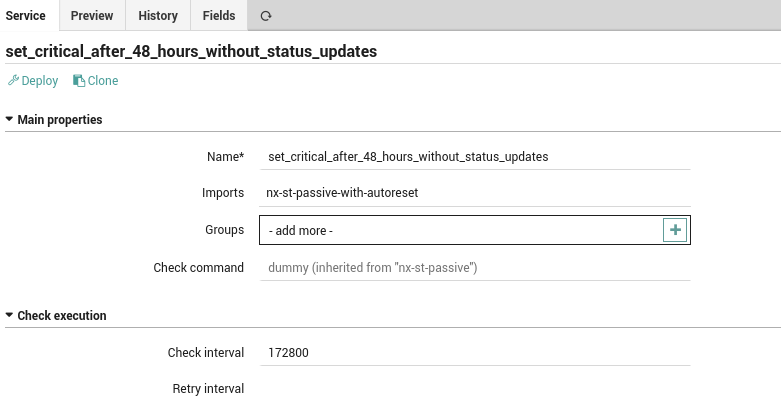
We need to create the service template of the service that will be created from the Tornado action. We do that from the Director module.
It must import nx-st-passive-with-autoreset. It’s also important to set the Returned Plug-in state to Critical/Down and the Check interval to 2 days (172800).
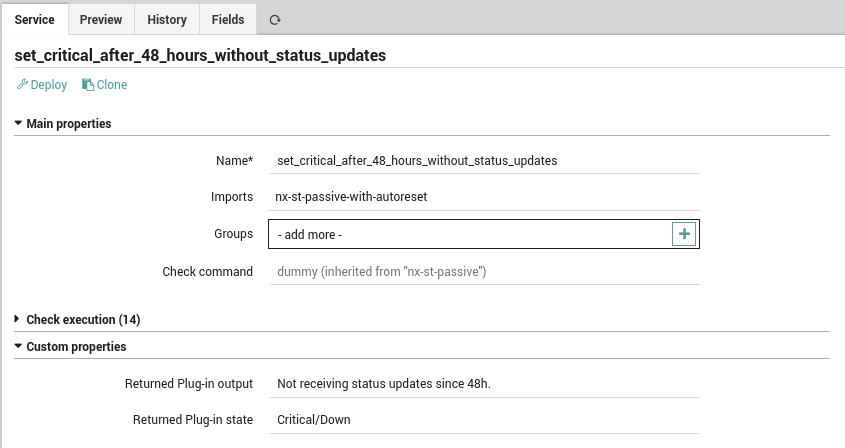
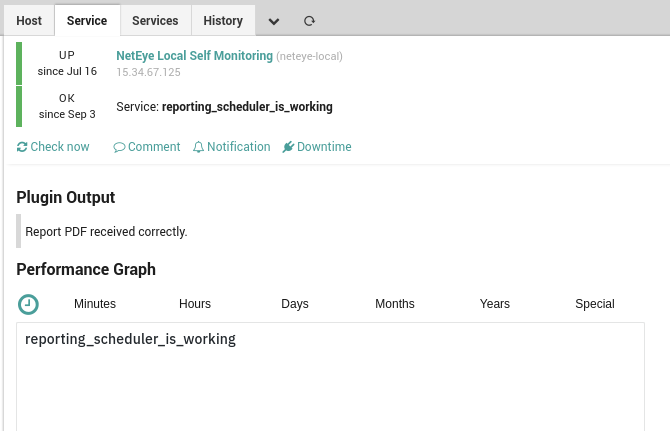
You can now test the configuration by sending a test event from Tornado, or else directly by sending the report from the Reporting module with the right subject and recipient.
Enjoy the new check! 😉
These Solutions are Engineered by Humans
Did you find this article interesting? Does it match your skill set? Our customers often present us with problems that need customized solutions. In fact, we’re currently hiring for roles just like this and others here at Würth Phoenix.


