We all know that NetEye Upgrades are boring activities. Upgrading is important and useful because it brings you bug fixes and new features, but nonetheless it’s extremely expensive in terms of time. The most boring, tiring and lengthy part is when you restart NetEye Services; if you have the SIEM Module installed, the time spent on Service Restart increases because of the ELK Stack, and if you add Elastic Data Only Nodes to the mix, the time spent on restarting grows exponentially with the number of Cluster Nodes you have, allowing you to embrace a whole new level of boredom.
As far as I know, NetEye Cloud has the widest ELK Stack around, with more than 20 Elasticsearch instances working below it, and when you need to perform a rolling restart on them to finalize the upgrade, well… it simply takes too long. So I took some time out to try to reduce how much time is spent on this task.
Why Does Restarting Take So Much Time?
The question is not well posed. Elasticsearch Unit’s restart doesn’t take too much time on its own: just from 2 to 5 minutes. Given that it runs on Java, this is a respectable amount of time. But right after the Unit restarts, Elasticsearch Cluster is not in top shape: Its status is Yellow, making it “vulnerable” to data-loss in the event another Elasticsearch Instance is restarted, so we need to wait until the Elasticsearch Cluster status becomes Green again before proceeding. So the question really should be “Why does Elasticsearch Cluster takes so much time to become Green again?”.
We can make some assumptions by guessing what Elasticsearch Cluster does when one of its instances is restarted.
First of all, Elasticsearch Cluster is not really aware it’s being restarted: it doesn’t know if a disappearing node will come up afterwards or not, so it cannot make assumptions about the operation (and it should not), so its only option is to recover from its damaged state. So then, what happens?
- Elasticsearch Cluster understands a node has left the Cluster, and marks all Shards assigned to it as “lost”
- Elasticsearch Cluster immediately promotes Active Replica Shards to Active Primary Shards:
- Data ingestion can continue storing data on the promoted Shards
- Some Indices now have no backup replica, so the Elasticsearch Cluster Status becomes Yellow
- Elasticsearch Cluster calculates on which Cluster Nodes the new Replica Shards must be created
- Elasticsearch Cluster starts replicating the missing Shards on the selected Nodes
- After all Shards have been replicated, the Elasticsearch Cluster Status becomes Green again
The issue here comes in at point #2:
- The Cluster immediately tries to heal by creating new Replica Shards, invalidating the copy managed by the restarting Elasticsearch Instance
- If the contents of an Active Primary Shard change, the copy managed by the restarting Elasticsearch Instance will become invalid
While this guarantees Service Resiliency, it also generates resync work that should be avoided.
What NetEye Does to Speed up Restarts
To ease this bloat of extra work, NetEye implements a specific strategy. In fact, it prohibits the relocation of Replica Shards on a Cluster during the restart of an Elasticsearch Instance; this is done by setting cluster.routing.allocation.enable to primary (see https://www.elastic.co/guide/en/elasticsearch/reference/current/modules-cluster.html#cluster-shard-allocation-settings for more details). This reduces the burden on resync by blocking the healing of Replica Shards until the node becomes up again: the Cluster will not try to regenerate Replica Shards immediately, reducing the need to resync only to those Indices whose contents are updated by Ingestion or other people’s activity. There are also other settings that affect this behavior at both the Cluster and Index Level, but let’s say this has the most impact.
Timeline of a Restart
To improve something, we first need to look at it and understand it, so here’s the timeline of a restart for you. This is the restart of an Elasticsearch Instance that manages Hot Data without any facilities from NetEye:
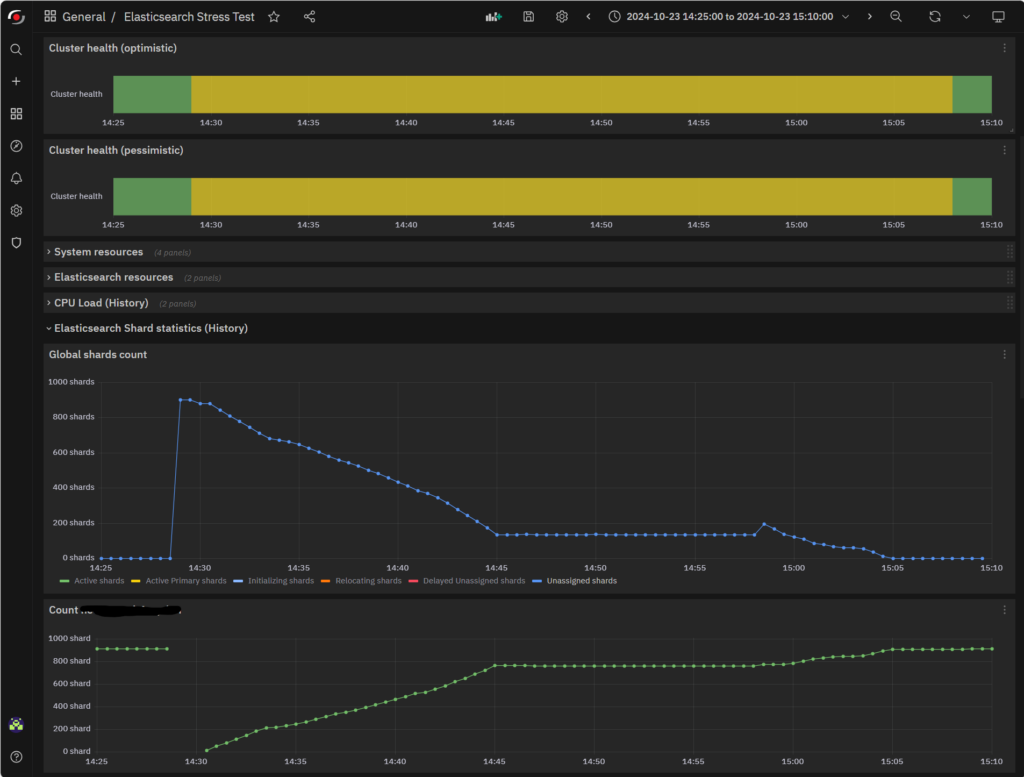
As you can see, the restart began at 14:28 and finished at 15:08, requiring exactly 40 minutes. Strictly speaking, Shard reallocation finished at 15:05, but the Cluster still had some work to do. And 3 minutes out of a total of 40 is not so much as to alter the overall benchmark.
The interesting part is that Unassigned Shards goes down linearly just as much as the Shard Count on the node goes up, but right at 14:45 it seems to plateau. This is most likely due to the invalidation of some Replica Shard that the cluster needed to resync.
Why does Cluster Healing take so long?
The time wasted during that plateau is too much. What is the Elasticsearch Instance doing in the meantime? The answer is: nothing.
Here’s the CPU load: given the fact that this server has 48 Cores, this load is basically nothing.

And here’s some I/O (Disk and Network): the increase in I/O activity is progressive, so it’s due to Shard Reactivation (the Elasticsearch Instance is progressively taking a larger part in queries and ingestion).
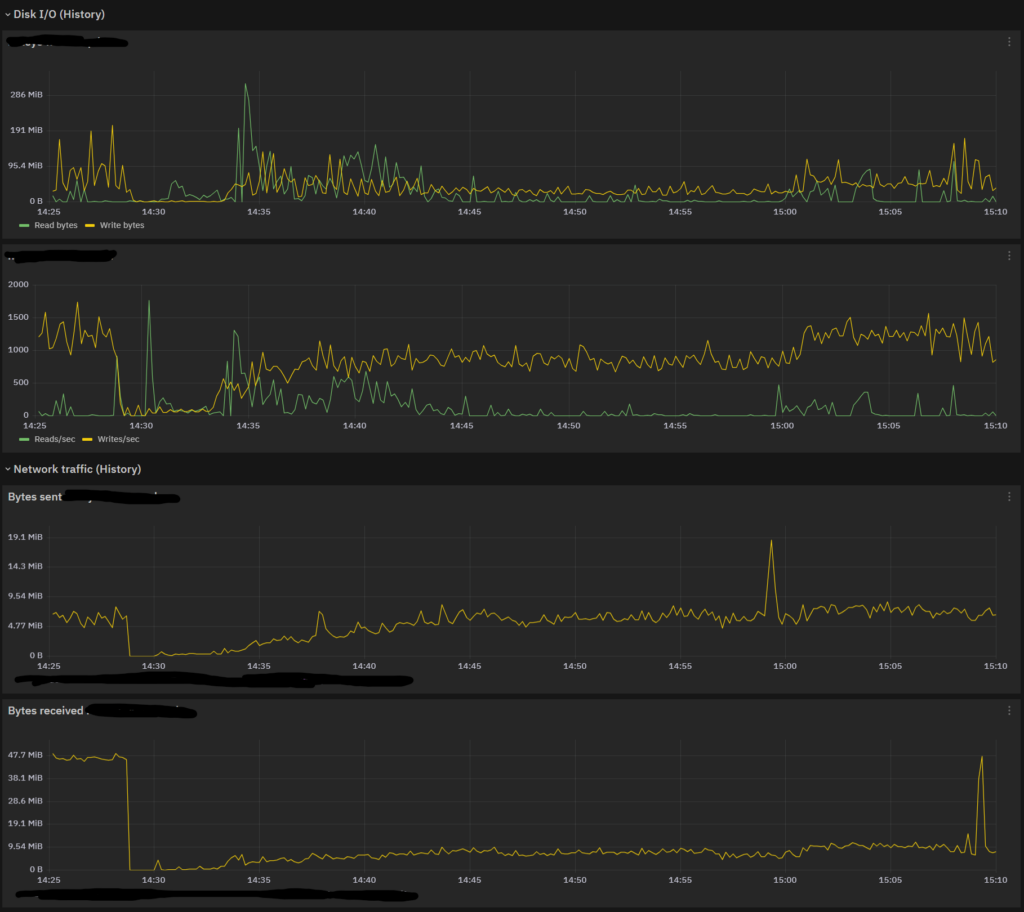
So, what’s happening? The answer lies in the default settings for https://www.elastic.co/guide/en/elasticsearch/reference/current/recovery.html#recovery-settings.
By default, Elasticsearch moves only one Shard at a time, using two streams of data, and everything is capped at a speed of 40MBytes/sec. So, when there is some Shard that needs to be replicated, Elasticsearch:
- Manages one Shard at time
- The Shard is copied using two TCP Streams (most likely, one for the first half and one for the second half) at the same time
- Peak speed is limited to only 400Mbits/sec (40MBytes/sec)
To recover just one 50GB Shard, you’ll need at best 1280 seconds, or around 20 minutes. And here we have our main reason. The answer is obvious: we need to modify these settings.
Increasing Index Recovery Speed
The most straightforward thing is to remove the bandwidth limit: NetEye Product Specifications require you to have a 10Gb/sec dedicated link for a NetEye Cluster if you want to run the SIEM Module, so why should it be limited to only 400Mb/sec?
The maximum value suggested for indices.recovery.max_bytes_per_sec by Elasticsearch is 250MBytes/sec, so why not use it? Let’s see how it performs with that setting:
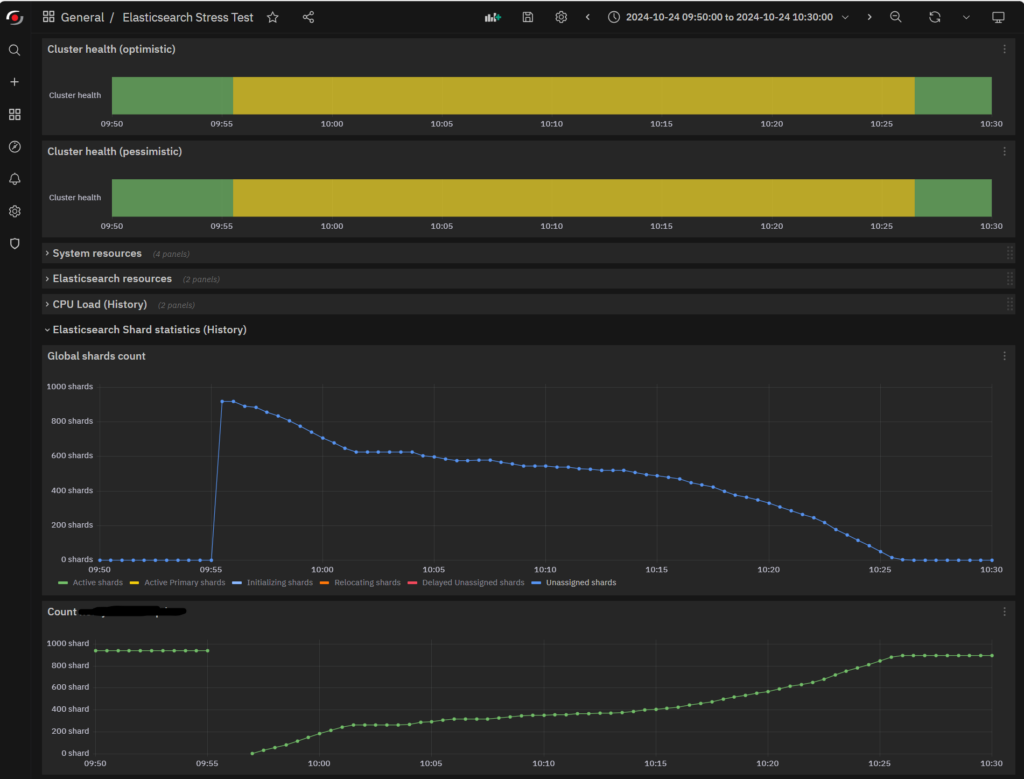
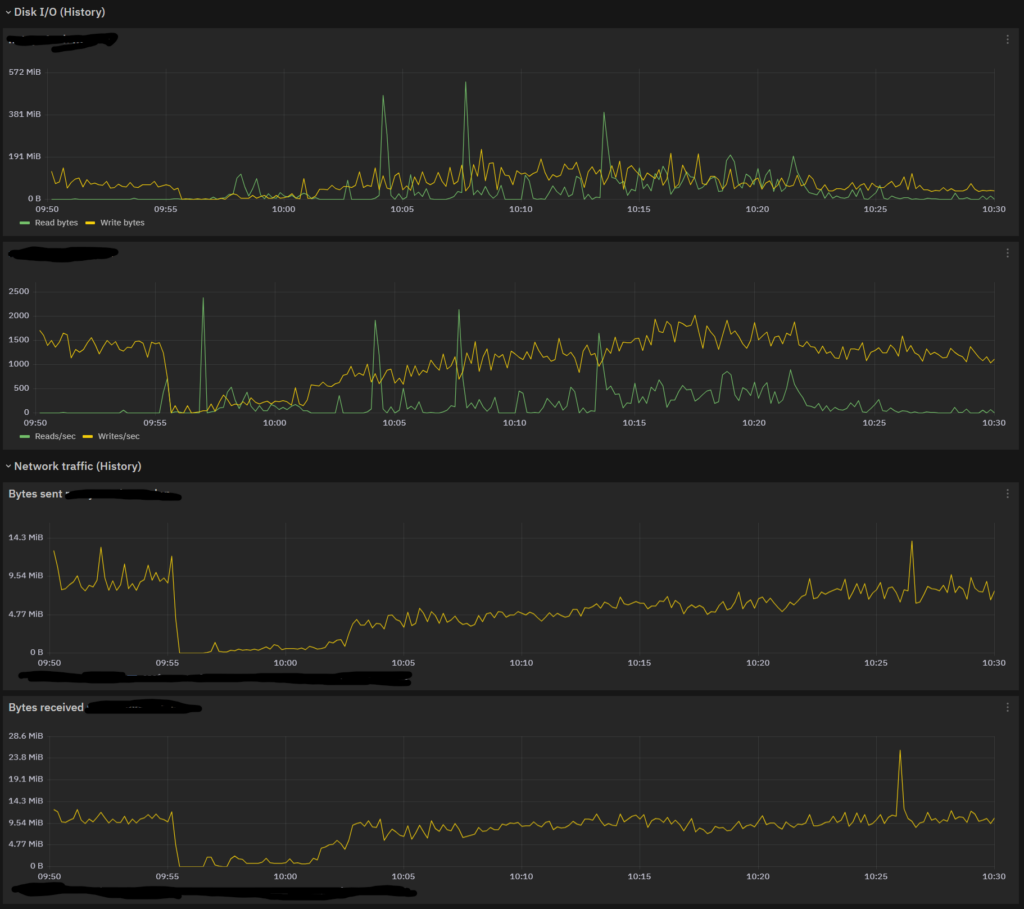
The restart time is reduced to 30 minutes. This is a better result, but not good enough. As you can see, the plateau is still there, even if it’s not so flat anymore. If you look at the I/O, you’ll notice a slight improvement in the Bytes Received, but not quite what we hoped for.
Modifying Expert Settings
Since the simple option isn’t enough, now it’s time for advanced ones. Elasticsearch suggests not using them because they can cause instability on the Cluster, and I agree: Shard Recovery happens at the Cluster Level, so there’s no way to confine it to specific Data Layers or Nodes, and there’s no telling which nodes will be involved in advance, so you might suffer poor performance due to Network Bandwidth exhaustion, or crash your nodes because their free disk space goes to 0, so take care to follow these two rules:
- Don’t exceed the maximum capacity of your Network Link, even if you can see it’s not being used properly (or completely) by the Cluster
- Set your Disk Watermarks to accommodate the maximum number of incoming Shards Replica a node can have (if your node can receive two Shards and your max Shard Size is 50GB, your watermarks must be at least 100GB or higher)
After saying this, let’s push the Network a bit further. Set indices.recovery.max_concurrent_operations to 2 as a first try and, just because it cannot harm the system, set indices.recovery.max_concurrent_file_chunks to 4. Then, try a restart:
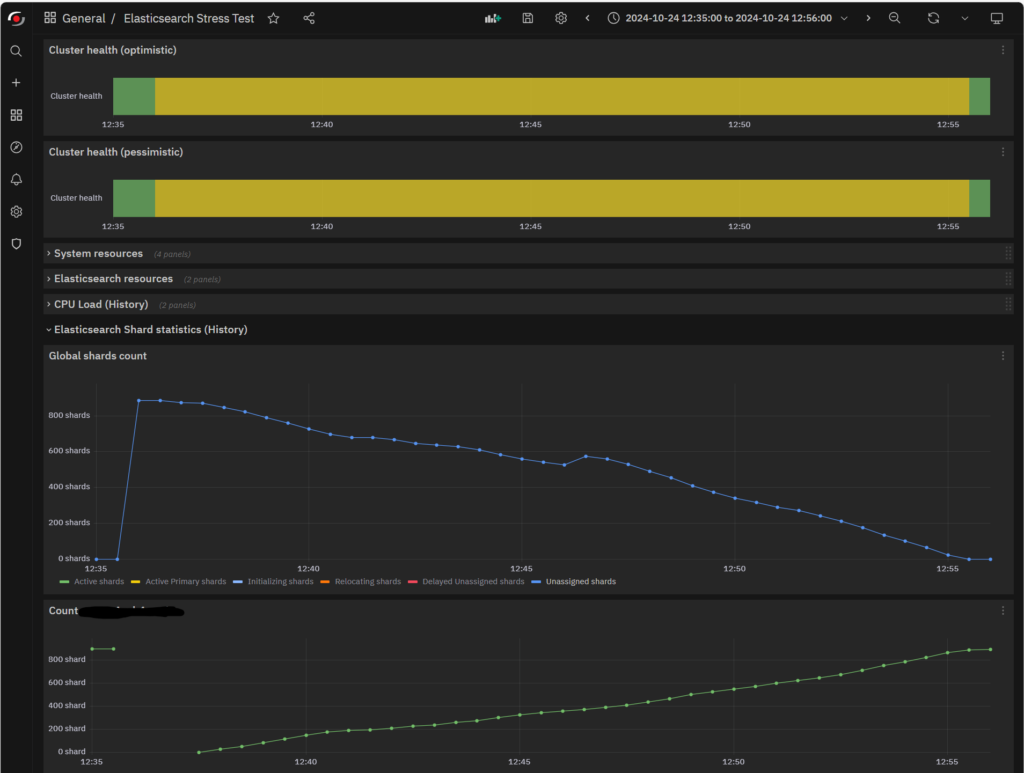
Here’s an even better result: now the restart time is down to only 21 minutes. The plateau is constantly decreasing, and Network Bandwidth is filled 5 minutes earlier.
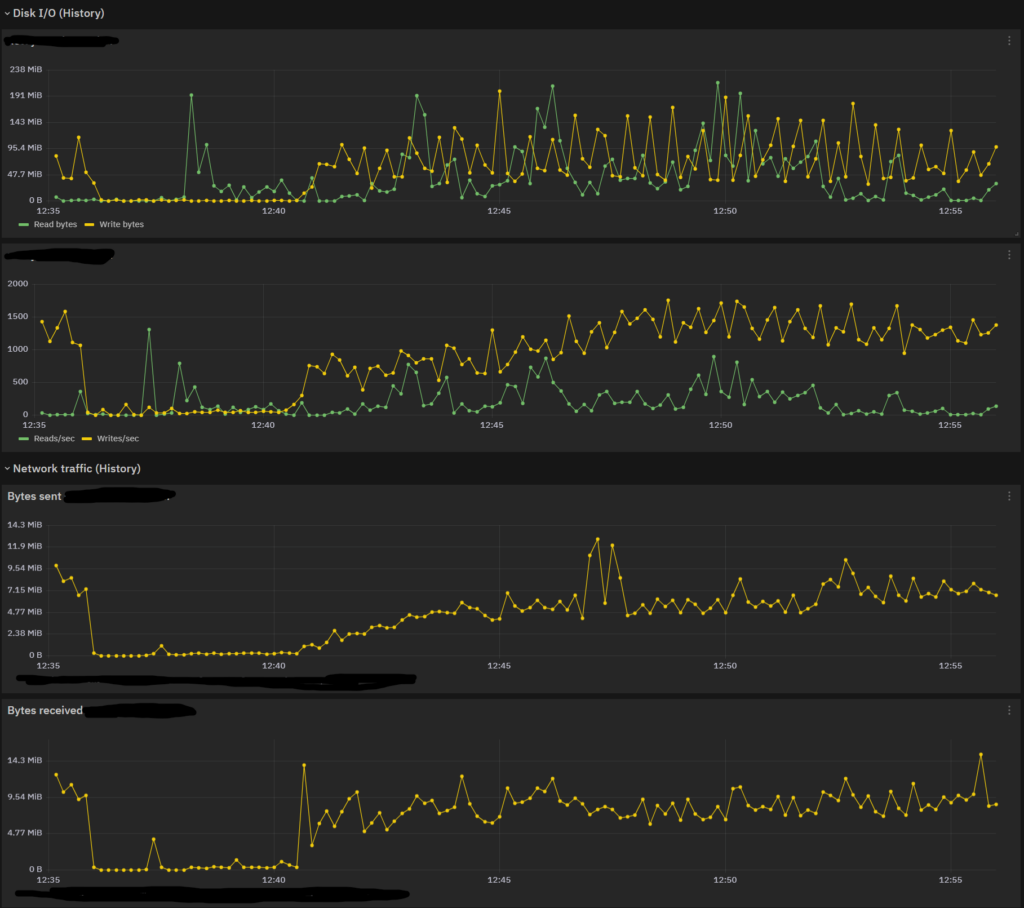
Since these numbers didn’t convince me at the time, I tried some more restarts at different times of the day, but the results were always the same. So perhaps the impact of these settings is not too terribly noticeable on a single node, but it did speed up activities on the other nodes, making the Cluster heal faster.
Final Considerations
Changing the Indices recovery settings can improve Shard Relocation and Cluster Healing time, but it’s really difficult to evaluate their impact. It’s always a good thing to time the Network parameters on your Cluster, but always be aware of the consequences in terms of both system responsivity (e.g., always leave enough bandwidth on Network Links to avoid bottlenecks) and system failure (ensure you won’t exhaust the available Elasticsearch disk space, or you’ll start losing nodes first, and then the Cluster).
By looking at the Elasticsearch documentation, we also found out that we can make further improvements with the SHUTDOWN API, but that’s a story for another day.
These Solutions are Engineered by Humans
Did you find this article interesting? Does it match your skill set? Our customers often present us with problems that need customized solutions. In fact, we’re currently hiring for roles just like this and others here at Würth Phoenix.


