


18. 03. 2025
Icinga Web 2, ITOA, NetEye, UI, Unified Monitoring

As you may have noticed from recent posts from some of my colleagues about “Boosting NetEye CI Speed: Test Parallelization” or “Speeding up the NetEye CI Testing Phase“, we are improving our CI in order to have a reliable, fast system that is able to test all the features we implement in NetEye 4. As our product grows in complexity, our tests and the CI system itself will grow as well, and we need to put some effort into maintaining the system that will ensure that our new features work as planned and integrate well with the system as a whole.
Inevitably, keeping the CI testing system reliable and fast is a recurring challenge in our case given the continuous implementation and addition of new features. That’s why it’s useful for us to keep track of the timing not only of test execution, but also of the various build and installation phases of our product. That way it will be possible to have a clearer view and give us more control over NetEye’s behavior.
A good understanding of the time needed for building and testing will make us aware of two aspects about the management and development of NetEye:
- The weak points of the product would be immediately identified. In fact by monitoring the timing of all the configuration, installation, and upgrade procedures, the steps that take the longest and thus slow down the procedures would immediately emerge. Applying a kind of “Theory of constraints” to NetEye development and improvement, it’s precisely in these points that emerge that one would have to work on to achieve good results.
- Slowdowns due to the implementation of new features or the inclusion of new tests would give us a clearer view of the timing of our CI processes, and would indeed give us an almost immediate answer to the weight that a new feature would give, in terms of timing, to the product. This information would help us further improve development by making us aware of changes in the final product as a whole.
The solution we decided to apply to achieve these results was to use technologies already present in our product: The CI system will collect the metrics needed for the required analysis such as the timings of all pipeline stages as well as their outcome. To further enhance the available information and achieve a higher awareness of our CI systems, metrics regarding the memory and processor load of each node are also collected through Telegraf. All the information will then be saved in InfluxDB, ready to be visualized through Grafana.
Implementation
Although it may seem simple on paper, the implementation of this CI monitoring system was not easy and involved challenges in each step, from collection to visualization.
The first challenge was the need to collect homogeneous and comparable data from different systems: not only was it necessary to collect information from nodes using Jenkins and nodes in the OpenShift cluster used by CI, but also to collect from the various pipelines data that, to achieve the desired goal, had to be compared with each other.
First and foremost were the timings, pipeline stages and their states: to give a trivial but significant example, stages that performed the same operations in different pipelines and systems had to be identifiable in order to be grouped and compared with each other.
Once the data were collected in a consistent and comparable way, the next challenge was to save them in InfluxDB in a structured and interpretable way. InfluxDB, being a database optimized for temporal data, is perfect for tracking timing and system resources. To make the data useful and meaningful, we defined a clear and consistent structure for our data points.
This required defining measures and tags for each data point collected. For example, the duration of a pipeline stage or CPU utilization had to be accompanied by tags that provided context, such as node name, pipeline type, or execution environment. Normalization of stage and pipeline names was crucial to facilitate data comparison and aggregation. These steps allowed us to build a robust dataset adaptable to future changes, making longitudinal analysis and continuous performance monitoring of our CI infrastructure possible.
Visualization of the collected data was another significant challenge. We chose Grafana as our visualization tool because of its flexibility and power in representing temporal data. However, creating technically accurate and easily interpretable dashboards requires considerable design work.
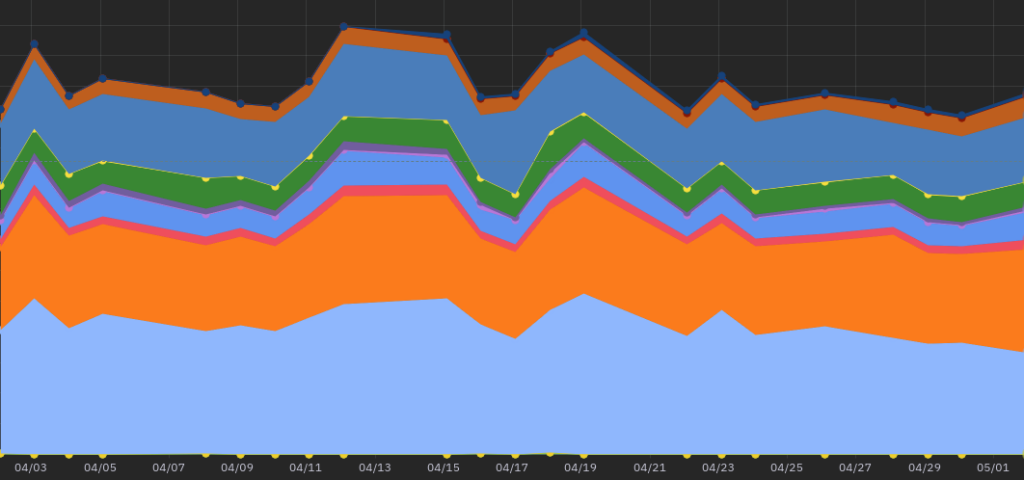
The dashboards had to be intuitive, allowing even colleagues who had no context for the work being done to quickly understand the status of the CI. We used simple graphs and visualizations, such as timelines for pipeline durations and their stages, representing in color all pipeline steps overlaid on top of each other so as to have a lot of easily interpretable and comparable information available in one graph.
Other temporal graphs were used for representation of node resources over time and percentages of failed pipelines. In addition, we implemented filters and aggregation options that would allow users to explore data at different levels of detail, from a single pipeline stage to monthly performance overviews.
Conclusion
Effective monitoring of our testing and CI infrastructure is critical to keeping the system reliable and fast, especially as new features are continually added. Through the implementation of a structured data collection system and intuitive visualization, we’ve been able to gain a deeper understanding of the performance of our CI process.
This knowledge allows us to quickly identify and resolve bottlenecks, assess the impact of new features, and maintain a streamlined and efficient workflow. Despite the challenges encountered along the way, the investment in robust and detailed monitoring has proven invaluable to the continuous improvement and growth of our product.
These Solutions are Engineered by Humans
Did you find this article interesting? Does it match your skill set? Programming is at the heart of how we develop customized solutions. In fact, we’re currently hiring for roles just like this and others here at Würth Phoenix.
Emil Fazzi
Software Developer, R&D Team in the "IT System & Service Management Solutions" group at Würth Phoenix.
Author
Latest posts by Emil Fazzi
17. 01. 2025
Automation, Development, Documentation, Log-SIEM
Elasticsearch Magic: Achieving Zero Downtime during User Guide Updates