NetEye 4.35 Release Notes
Welcome to version 4.35 of our NetEye v4 Unified Monitoring Solution.

NetEye 4.35 is welcoming you with a breathtaking view of the Lago di Carezza (Karersee). It is also called “Rainbow Lake”. The lake is unique as it gleams with all colors of the rainbow, which makes it a favorite destination for professional photographers and Instagrammers throughout the year. The Latemar and Rosengarten massifs are reflected in its waters, creating a beautiful natural spectacle. Late spring through summer is the best time to visit it.
General
Security Improvements
We ensured our product uses only the most secure encryption protocols and algorithms to guarantee the highest levels of security. We also minimized the exposed attack surface by working at the level of individual services.
Upgrade and Update Process
The process of upgrading and updating has been made faster, especially for multi-tenant environments. In particular, complex operations that previously were slowing down the process have been optimized.
NetEye Commands
We have improved the access to the history of all executed NetEye commands. All output from NetEye commands will now be stored in log files, so you can conveniently check what exactly occurred during a certain period of time, e.g. during the last upgrade. You can find more details about this in the user guide.
Monitoring – Detection
Tornado – Import / Export
Our goal is to provide an easy way to backup or copy the processing tree from a test system to the production system or move configuration in between nodes.
To achieve this goal, we introduced the ability to export and import nodes and their children from the Tornado Processing Tree via web UI. This allows for much easier configuration between multiple instances or tenants.
To check out how it works, please refer to the import-export section of the NetEye user guide.
Tornado – User Guide Structure Refactoring
In order to improve the usability of the documentation on how to configure Tornado, the User Guide structure was refactored and now presents a clearer understanding of the lifecycle of an Event within the Tornado Module.
We took the opportunity to cover the process of extracting variables from events within Tornado. This is achieved by providing comprehensive explanations and examples that illustrate various scenarios and use cases. Our aim is to provide comprehensive documentation that guides our users to quickly understand and implement this functionality in their workflows.
APM – User Experience
Alyvix – Dashboard Tooltips
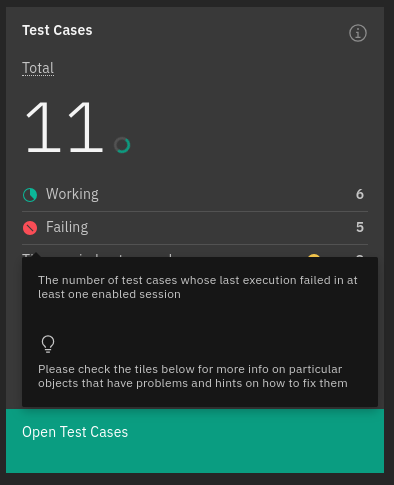
The Alyvix Dashboard is the ideal location for gaining a comprehensive understanding of your Alyvix installation. To enhance user comprehension, in NetEye 4.35 we introduced numerous helpful tooltips to clarify various concepts, thereby improving the analysis experience.

Alyvix – Time Periods
As a user of Alyvix, you might want to use it to visually monitor your applications only when they are expected to be active, such as during certain hours or days. For example, you might only want to use visual monitoring for an application on weekdays from 9 AM to 5 PM because that’s when your application is in use.
That’s why NetEye 4.35 lets you link a Time Period, which you can define through the Icinga Director, to your Test Cases. This gives you the option to set, if needed, when exactly a Test Case should run, so that the visual monitoring of your application only happens when necessary.
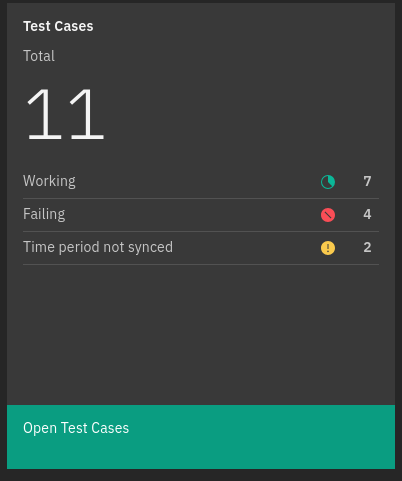
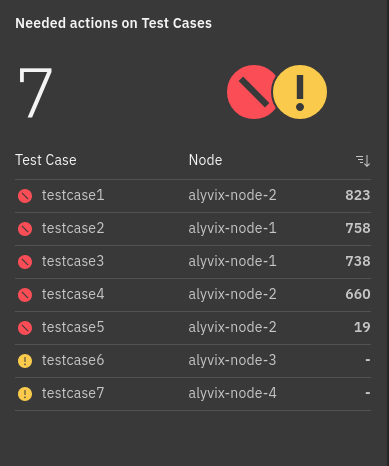
And to keep you informed about the status of the Alyvix Time Periods with respect to the corresponding ones on NetEye, the Alyvix dashboard has been enriched with information about the Time Periods sync status, highlighting also which Test Cases are using a Time Period which needs to be synced up!


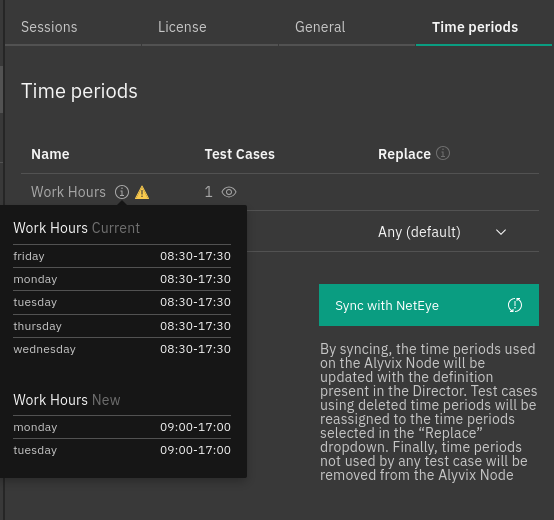
To manage and synchronize Time Periods, you can utilize the new dedicated tab located in the Nodes page. This tab also provides detailed information regarding the ranges of available Time Periods and highlights their differences from their definitions in the Director.

For more information, please check out our official related User Guide!
Alyvix – UX improvements
We have enhanced the User Experience with the Alyvix integration by clarifying the labels associated with certain actions. Additionally, we have improved the search functionality on Nodes and Test Cases, making it easier to locate specific items.
SIEM – Log Management
Kibana Profiles and Security Cases
To simplify the management of security operations, it is now possible to assign Security Cases to Kibana users. This is made possible by the automatic creation of User Profiles for users logging into Kibana.
Log Manager module deprecation
ELK stack and El Proxy have long been the standard in log management in NetEye.
For this reason, the Log Manager module is now deprecated and will be removed in one of the next releases.
A deprecation banner has been added to the main Log Manager dashboard to notify you of the module deprecation, if you are still using this module it is recommended that you migrate to ELK and drop the Safed agent in favor of using the Elastic Agent as soon as possible.
Service Management – Incident Response
IT Operations (Command Orchestrator)
We made the Command Orchestrator more user-friendly by improving the way you choose a hostname in the remote command execution section. Now you can search and filter among the hosts that are shown.


