Monitoring, Collection of Metrics and Dashboard of the NetEye Database
As you all know NetEye uses MariaDB as its database. With the nep-monitoring-core module of the NetEye Extension Packs (NEP), the following aspects of MariaDB are monitored:
- connection-time
- open-files
- running-threads
- uptime
- total-threads
These checks are performed with a default time interval (check_interval) of 180s.
To have real time control of many aspects of the MariaDB database operation, I suggest installing the innotop tool.
# dnf install innotop --enablerepo=epel
In various situations it can also be very useful to monitor database performance more frequently, and keep a history of operating metrics over an extended period of time with the aim of identifying any previous problems and being able to create dedicated dashboards.
In this blog we’ll see how to proceed for the latter scenario using the ITOA module included in NetEye.
Telegraf Agent Configuration
To collect MariaDB operating metrics we can configure the Telegraf agent already included in each NetEye node using the MySQL input plugin.
To handle scenarios where NetEye nodes are configured in clusters, it’s necessary to create a dedicated instance of Telegraf by creating the file /neteye/local/telegraf/conf/neteye_collector_local_perfs_mysql.conf as shown below.
Important:
- in the servers parameter of the section
[[outputs.nats]]you must use the FQDN of the NetEye Master - in the servers parameter of the section
[[inputs.mysql]]you must use the username/password pair that has only select rights on the MySQL tables (in the example the username is mariadbreadonly)
# Telegraf Configuration
#
# Telegraf is entirely plugin driven. All metrics are gathered from the
# declared inputs, and sent to the declared outputs.
#
# Plugins must be declared in here to be active.
# To deactivate a plugin, comment out the name and any variables.
#
# Use 'telegraf -config telegraf.conf -test' to see what metrics a config
# file would generate.
#
# Environment variables can be used anywhere in this config file, simply surround
# them with ${}. For strings the variable must be within quotes (ie, "${STR_VAR}"),
# for numbers and booleans they should be plain (ie, ${INT_VAR}, ${BOOL_VAR})


# Global tags can be specified here in key="value" format.
[global_tags]
  # dc = "us-east-1" # will tag all metrics with dc=us-east-1
  # rack = "1a"
  ## Environment variables can be used as tags, and throughout the config file
  # user = "$USER"


# Configuration for telegraf agent
[agent]
  ## Default data collection interval for all inputs
  interval = "10s"
  ## Rounds collection interval to 'interval'
  ## ie, if interval="10s" then always collect on :00, :10, :20, etc.
  round_interval = true

  ## Telegraf will send metrics to outputs in batches of at most
  ## metric_batch_size metrics.
  ## This controls the size of writes that Telegraf sends to output plugins.
  metric_batch_size = 1000

  ## Maximum number of unwritten metrics per output.  Increasing this value
  ## allows for longer periods of output downtime without dropping metrics at the
  ## cost of higher maximum memory usage.
  metric_buffer_limit = 10000

  ## Collection jitter is used to jitter the collection by a random amount.
  ## Each plugin will sleep for a random time within jitter before collecting.
  ## This can be used to avoid many plugins querying things like sysfs at the
  ## same time, which can have a measurable effect on the system.
  collection_jitter = "0s"

  ## Default flushing interval for all outputs. Maximum flush_interval will be
  ## flush_interval + flush_jitter
  flush_interval = "10s"
  ## Jitter the flush interval by a random amount. This is primarily to avoid
  ## large write spikes for users running a large number of telegraf instances.
  ## ie, a jitter of 5s and interval 10s means flushes will happen every 10-15s
  flush_jitter = "0s"

  ## By default or when set to "0s", precision will be set to the same
  ## timestamp order as the collection interval, with the maximum being 1s.
  ##   ie, when interval = "10s", precision will be "1s"
  ##       when interval = "250ms", precision will be "1ms"
  ## Precision will NOT be used for service inputs. It is up to each individual
  ## service input to set the timestamp at the appropriate precision.
  ## Valid time units are "ns", "us" (or "µs"), "ms", "s".
  precision = ""

  ## Log at debug level.
  # debug = false
  ## Log only error level messages.
  # quiet = false

  ## Log target controls the destination for logs and can be one of "file",
  ## "stderr" or, on Windows, "eventlog".  When set to "file", the output file
  ## is determined by the "logfile" setting.
  # logtarget = "file"

  ## Name of the file to be logged to when using the "file" logtarget.  If set to
  ## the empty string then logs are written to stderr.
  # logfile = ""

  ## The logfile will be rotated after the time interval specified.  When set
  ## to 0 no time based rotation is performed.  Logs are rotated only when
  ## written to, if there is no log activity rotation may be delayed.
  # logfile_rotation_interval = "0d"

  ## The logfile will be rotated when it becomes larger than the specified
  ## size.  When set to 0 no size based rotation is performed.
  # logfile_rotation_max_size = "0MB"

  ## Maximum number of rotated archives to keep, any older logs are deleted.
  ## If set to -1, no archives are removed.
  # logfile_rotation_max_archives = 5

  ## Override default hostname, if empty use os.Hostname()
  hostname = ""
  ## If set to true, do no set the "host" tag in the telegraf agent.
  omit_hostname = false


###############################################################################
#                            OUTPUT PLUGINS                                   #
###############################################################################


# # Send telegraf measurements to NATS
[[outputs.nats]]
   ## URLs of NATS servers
   servers = ["nats://neteye-master.mydomain.com:4222"]

   ## Optional credentials
   # username = ""
   # password = ""

   ## Optional NATS 2.0 and NATS NGS compatible user credentials
   # credentials = "/etc/telegraf/nats.creds"

   ## NATS subject for producer messages
   subject = "telegraf.metrics"

   ## Use Transport Layer Security
   secure = true

   ## Optional TLS Config
   tls_ca = "/neteye/local/telegraf/conf/certs/root-ca.crt"
   tls_cert = "/neteye/local/telegraf/conf/certs/telegraf_wo.crt.pem"
   tls_key = "/neteye/local/telegraf/conf/certs/private/telegraf_wo.key.pem"
   ## Use TLS but skip chain & host verification
   # insecure_skip_verify = false

   ## Data format to output.
   ## Each data format has its own unique set of configuration options, read
   ## more about them here:
   ## https://github.com/influxdata/telegraf/blob/master/docs/DATA_FORMATS_OUTPUT.md
   data_format = "influx"


###############################################################################
#                            INPUT PLUGINS                                    #
###############################################################################


# Read metrics from one or many mysql servers
[[inputs.mysql]]
  ## specify servers via a url matching:
  ##  [username[:password]@][protocol[(address)]]/[?tls=[true|false|skip-verify|custom]]
  ##  see https://github.com/go-sql-driver/mysql#dsn-data-source-name
  ##  e.g.
  ##    servers = ["user:passwd@tcp(127.0.0.1:3306)/?tls=false"]
  ##    servers = ["user@tcp(127.0.0.1:3306)/?tls=false"]
  #
  ## If no servers are specified, then localhost is used as the host.
  servers = ["mariadbreadonly:XXXXXXXXXXXXXXXXXXXXXXXXXXX@tcp(mariadb.neteyelocal:3306)/"]

  ## Selects the metric output format.
  ##
  ## This option exists to maintain backwards compatibility, if you have
  ## existing metrics do not set or change this value until you are ready to
  ## migrate to the new format.
  ##
  ## If you do not have existing metrics from this plugin set to the latest
  ## version.
  ##
  ## Telegraf >=1.6: metric_version = 2
  ##           <1.6: metric_version = 1 (or unset)
  metric_version = 2

  ## if the list is empty, then metrics are gathered from all database tables
  # table_schema_databases = []

  ## gather metrics from INFORMATION_SCHEMA.TABLES for databases provided
  ## in the list above
  # gather_table_schema = false

  ## gather thread state counts from INFORMATION_SCHEMA.PROCESSLIST
  # gather_process_list = false

  ## gather user statistics from INFORMATION_SCHEMA.USER_STATISTICS
  # gather_user_statistics = false

  ## gather auto_increment columns and max values from information schema
  # gather_info_schema_auto_inc = false

  ## gather metrics from INFORMATION_SCHEMA.INNODB_METRICS
  # gather_innodb_metrics = false

  ## gather metrics from all channels from SHOW SLAVE STATUS command output
  # gather_all_slave_channels = false

  ## gather metrics from SHOW SLAVE STATUS command output
  # gather_slave_status = false

  ## use SHOW ALL SLAVES STATUS command output for MariaDB
  # mariadb_dialect = false

  ## gather metrics from SHOW BINARY LOGS command output
  # gather_binary_logs = false

  ## gather metrics from SHOW GLOBAL VARIABLES command output
  # gather_global_variables = true

  ## gather metrics from PERFORMANCE_SCHEMA.TABLE_IO_WAITS_SUMMARY_BY_TABLE
  # gather_table_io_waits = false

  ## gather metrics from PERFORMANCE_SCHEMA.TABLE_LOCK_WAITS
  # gather_table_lock_waits = false

  ## gather metrics from PERFORMANCE_SCHEMA.TABLE_IO_WAITS_SUMMARY_BY_INDEX_USAGE
  # gather_index_io_waits = false

  ## gather metrics from PERFORMANCE_SCHEMA.EVENT_WAITS
  # gather_event_waits = false

  ## gather metrics from PERFORMANCE_SCHEMA.FILE_SUMMARY_BY_EVENT_NAME
  # gather_file_events_stats = false

  ## gather metrics from PERFORMANCE_SCHEMA.EVENTS_STATEMENTS_SUMMARY_BY_DIGEST
  # gather_perf_events_statements             = false
  #
  ## gather metrics from PERFORMANCE_SCHEMA.EVENTS_STATEMENTS_SUMMARY_BY_ACCOUNT_BY_EVENT_NAME
  # gather_perf_sum_per_acc_per_event         = false
  #
  ## list of events to be gathered for gather_perf_sum_per_acc_per_event
  ## in case of empty list all events will be gathered
  # perf_summary_events                       = []
  #
  # gather_perf_events_statements = false

  ## the limits for metrics form perf_events_statements
  # perf_events_statements_digest_text_limit = 120
  # perf_events_statements_limit = 250
  # perf_events_statements_time_limit = 86400

  ## Some queries we may want to run less often (such as SHOW GLOBAL VARIABLES)
  ##   example: interval_slow = "30m"
  # interval_slow = ""

  ## Optional TLS Config (used if tls=custom parameter specified in server uri)
  # tls_ca = "/etc/telegraf/ca.pem"
  # tls_cert = "/etc/telegraf/cert.pem"
  # tls_key = "/etc/telegraf/key.pem"
  ## Use TLS but skip chain & host verification
  # insecure_skip_verify = false
After creating the configuration file it’s necessary to configure the permissions of the file just created with the Telegraf user.
Important: in the case of multiple NetEye nodes, copy the file neteye_collector_local_perfs_mysql.conf to all nodes in the path /neteye/local/telegraf/conf/ and apply the same permissions:
# chown telegraf. /neteye/local/telegraf/conf/neteye_collector_local_perfs_mysql.conf
Then we need to check the configuration of Telegraf and its access to the MariaDB database running the agent in test mode:
# telegraf --config neteye_collector_local_perfs_mysql.conf --test
Now we can start the Telegraf agent on the node where MariaDB runs and check if the measurement related to the MySQL input plugin is created and the metrics are correctly collected:
# systemctl start telegraf-local@neteye_collector_local_perfs_mysql
# systemctl status telegraf-local@neteye_collector_local_perfs_mysql

# influx -username root -password $(cat /root/.pwd_influxdb_root) -host influxdb.neteyelocal -ssl
	> use telegraf_master
	Using database telegraf_master
	> show measurements
	name: measurements
	name
	----
	cpu
	disk
	diskio
	kernel
	mem
	mysql
    > select * from mysql limit 10;
Important: if the NetEye nodes are configured in clusters, it’s also necessary to create a dedicated resource. Here’s a configuration example:
# pcs property set stonith-enabled=false

# pcs resource create --no-default-ops --force -- telegraf_local_mysql_monitoring systemd:telegraf-local@neteye_collector_local_perfs_mysql op monitor interval=60 id=telegraf_local_mysql_monitoring-monitor-interval-60 timeout=100 start interval=0s id=telegraf_local_mysql_monitoring-start-interval-0s timeout=15 stop interval=0s id=telegraf_local_mysql_monitoring-stop-interval-0s timeout=60 on-fail=block

# pcs resource restart telegraf_local_mysql_monitoring

## on node where mariadb is running
# systemctl status telegraf-local@neteye_collector_local_perfs_mysql

# pcs property set stonith-enabled=true
InfluxDB User Configuration
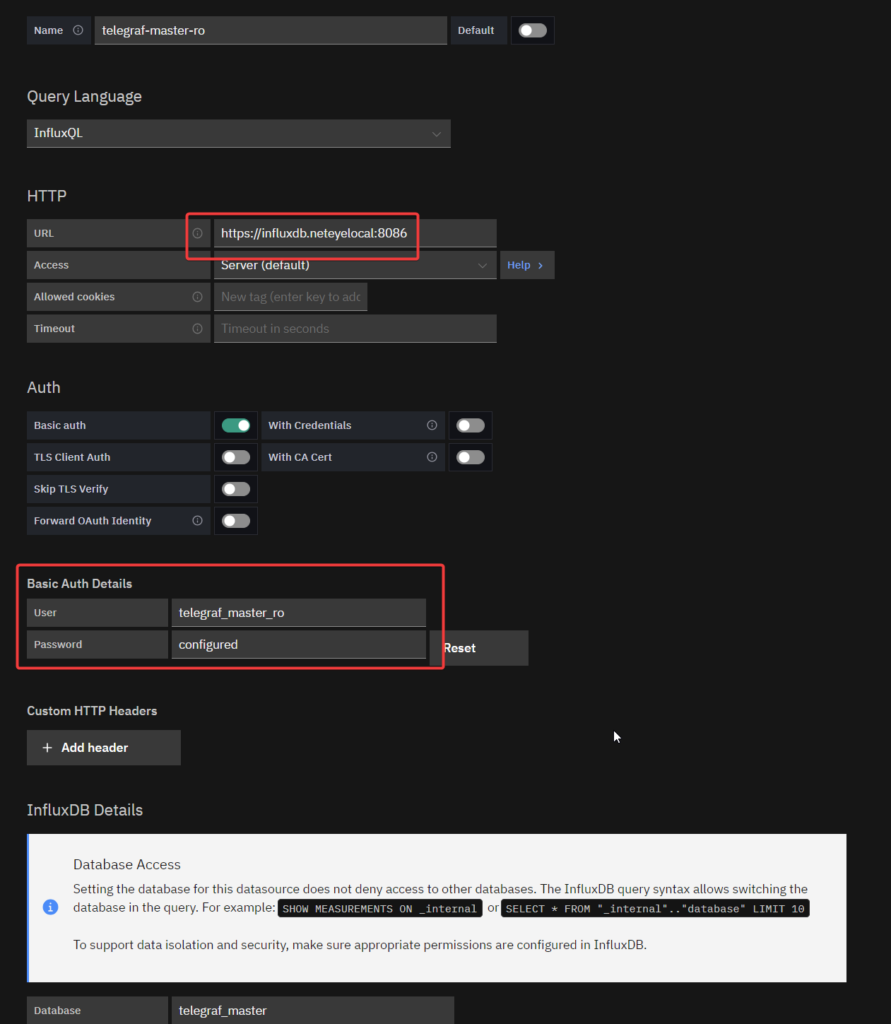
Once these steps have been completed, the Telegraf agent is configured to collect MariaDB usage metrics and write them to InfluxDB in the telegraf_master database. In order to access these metrics from Grafana and create a dashboard, you’ll need to create a dedicated InfluxDB user with only read rights on the telegraf_master database. In the following example, the user telegraf_master_ro is created:
# influx -username root -password $(cat /root/.pwd_influxdb_root) -host influxdb.neteyelocal -ssl
create user telegraf_master_ro with password 'XXXXXXXXXXXXXXXXX'
grant read on telegraf_master to telegraf_master_ro;
Grafana Dashboard and Datasource Configuration
To be able to read and visualize previously collected metrics, there’s no better way than using a dashboard with Grafana.
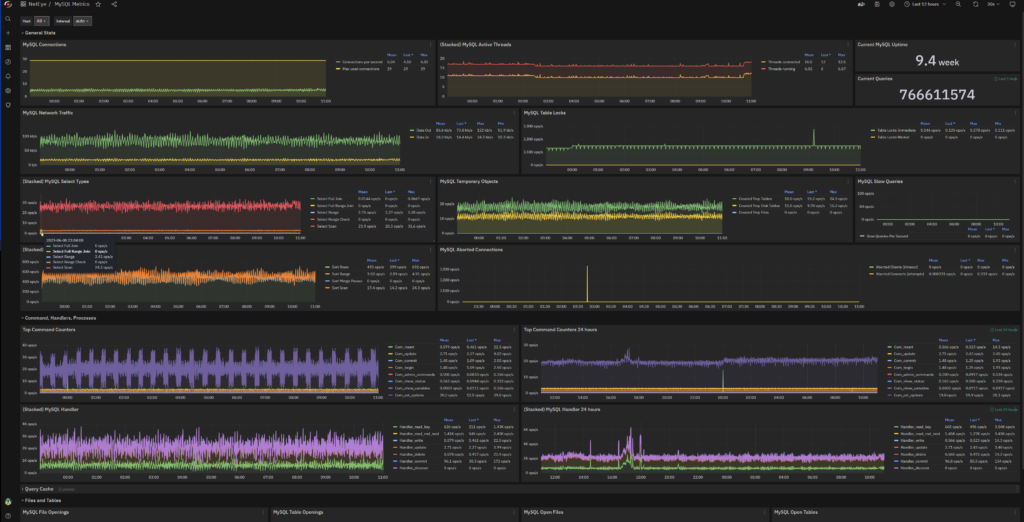
In our NetEye Demo you can find a ready-to-use example which was created starting from the freely available dashboard here.
I remind you that before importing the dashboard you’ll need to create a datasource as shown below using the user telegraf_master_ro and the password created in the previous step.

If you can’t remember how to import a dashboard into your NetEye, you can follow the instructions I reported in this blog post.
Finally, here is an example of the dashboard that you will get at the end.

These Solutions are Engineered by Humans
Are you passionate about performance metrics or other modern IT challenges? Do you have the experience to drive solutions like the one above? Our customers often present us with problems that need customized solutions. In fact, we’re currently hiring for roles just like this as well as other roles here at Würth Phoenix.


