NetEye 4.29 Release Notes
Welcome to version 4.29 of our NetEye v4 Unified Monitoring Solution.
With this release, NetEye welcomes us with a spectacular sunset view and a beautiful flower, symbol of the Dolomites. The Edelweiss, or “Stella Alpina”, is a protected flower that grows in high altitudes among the bare and rugged rocks of our mountains. Its gentleness and pure appearance inspired many myths and one of them tells the origins of the star-shaped flower:
“A long time ago there was a desolate high mountain: the mountain was in so much pain because of its loneliness but no tree or flower could do anything to comfort her. During a starry night, the stars noticed the lonely mountain and, a brave little star slipped down from the sky to lie on the icy rocks and keep company to the mountain. The climate up there was really cold and hostile for the little star and the mountain, touched by the brave and kind act of the star, wrapped her in a white fluff and hugged her to itself giving the star deep and strong roots.”

Monitoring – Detection
Icingaweb2 Module vSphereDB update to 1.6.0
A new version of Icingaweb2 Module vSphereDB brings a large number of new features and bug-fixes, including:
- integration of vCenter restrictions and filters into UI
- adding history for the state changes of the monitoring rules and single objects
- support for vSphere tags in UI
For a complete list of improvements check out the official documentation.
Icingaweb2 Module Director update to 1.10.2
The Icingaweb2 Module Director has been upgraded from version 1.9.1 to 1.10.2. From a large list of improvements and fixes aimed at importing and syncing rules, we would like to highlight the Sync Preview as one of the features that will improve the Module usability.
The complete changelog is available in the official repository.
SIEM – Log Management
El Proxy – Metrics
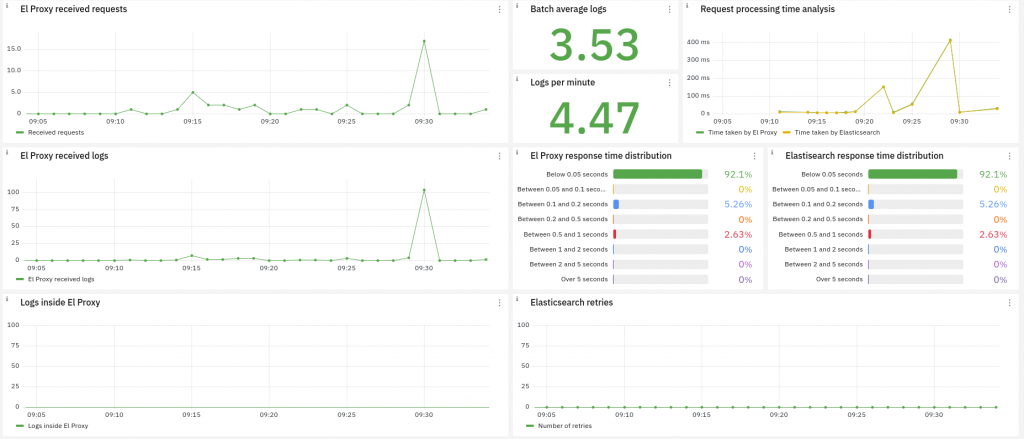
To allow administrators to inspect the workload, identify bottlenecks and debug issues, from now on El Proxy exposes various metrics related to the events inside the service. For instance, the metrics can reveal the number of processed logs by tenant and blockchain, and provide stats on successful and failed requests to Elasticsearch, etc.
NetEye then stores these El Proxy metrics in a dedicated InfluxDB database in order to build an easy-to-read dashboard with ITOA / Grafana.
Moreover, NetEye 4.29 provides an out-of-the-box solution to visualize the metrics in dashboards, related to performance and troubleshooting, available in the ITOA module in the El Proxy folder inside Grafana’s Main Org.
More information is available in this blog post and in the NetEye User Guide.

Service Management – Incident Response
Asset Management – GLPI upgrade to version 10.0.6
GLPI was updated from version 9.5.9 to version 10.0.6. To see the complete list of features and fixes brought by this update, please visit the GLPI official release notes.
To ensure compatibility with the latest version of GLPI, we also updated the OCS Inventory NG plugin for GLPI from version 1.7.3 to version 2.0.3.
Please ensure to update any GLPI Plugin installed on your system, selecting a version compatible with the new GLPI 10 release before proceeding with the upgrade.
Breaking change
Starting from GLPI 10, the rules of type Rules for import and link computers are no longer supported.
After the upgrade, all rules of the aforementioned type will no longer be present in the rule list and new rules will have to be created manually.
Asset management in multi-tenancy environments
In NetEye 4.29 it is now possible to collect assets from remote inventories that belong to different tenants using GLPI Agent.
With fully automated infrastructure configuration, from user authentication to entity management, NetEye simplifies administration and ensures the isolation of assets between different tenants.
Deprecation of OCS Inventory
Starting with NetEye 4.29 OCS Inventory is deprecated and will be removed in a future release in favor of GLPI Agent. OCS will still be supported in order to allow users to have a smooth migration to GLPI Agent.
Jira Service Management-Confluence-Jira
Incident Management – It is now possible to connect Zoom to Jira Service Management, so you can quickly make a call when an incident occurs. Moreover, you can document root causes and resolution methods from a resolved incident in order to avoid similar incidents in future.
Incoming Call Routing – Jira Service Management customers can now set up an Incoming Call Routing integration with Opsgenie.
Audit logs for Jira and Confluence permission changes – An important security change was made to Jira and Confluence: it is possible to have comprehensive audit logging for permissions changes in Jira and Confluence, including both admin and user-controlled permissions changes.
More templates for business teams – There are new project templates in Jira Service Management to help finance, marketing and analytics teams quickly set up a project (including pre-configured request types and workflows).
You can find more information here: Cloud Roadmap | Atlassian
Custom timeouts for Command Orchestrator
Commands executed from the Command Orchestrator can have massively varying runtime characteristics. From commands that terminate in a fraction of a second, to commands that need to run several minutes or hours. To accommodate for this range, we introduced a timeout option for the commands. You can now specify the maximal time the command is allowed to run during the command creation, giving the users more control over long running or misbehaving commands.
APM – User Experience
Visual Monitoring with Alyvix
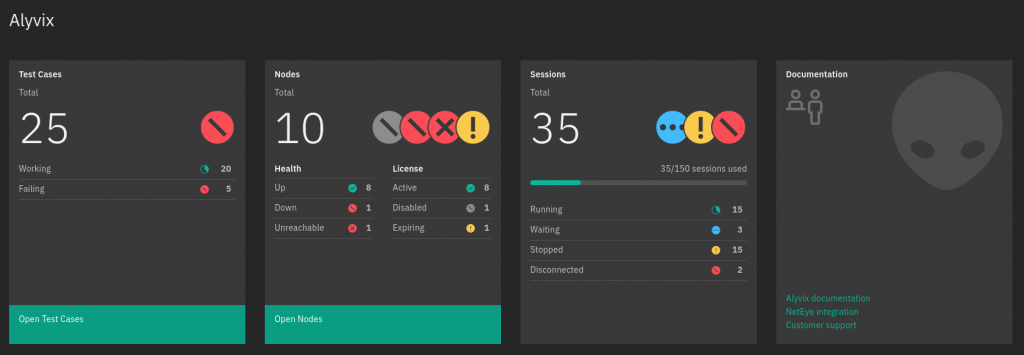
In order to provide a deeper insight into the configured Alyvix installation, we added more details to the Alyvix dashboard, such as a brief overview of the nodes’ health and license status, and a list of available sessions with their states and usage.
NetEye 4.29 comes ready to collect the performance data of the Alyvix Test Cases, which will also be visualized in the dashboards.
To better understand the difference between the two connected Alyvix session statuses – depending on whether the service is set to run test cases in the session or not, – the following status names were changed both in NetEye interface and User Guide:
- Connected → Waiting
- Connected but with the control session in Stop or Break → Stopped

User Guide
User Guide navigation
To improve user experience and usability when consulting the NetEye online User Guide (UG), all the documentation was migrated into a single project. This change will also be reflected in the syntax of UG URLs, with the latter fully representing the nesting of a page you’re looking for in the current UG structure.
One should be mindful though that switching to NetEye online User Guide v.4.29 from an older version may result in a 404 error due to the URL syntax incompatibility.
Installation procedure
For a better NetEye installation understanding, a number of new sections were added to the System Installation part of the online User Guide:
Cluster Fencing Configuration section describes the procedures you can use to configure, test and manage the fence devices in a cluster.
Cluster Services Configuration section completes the cluster installation paragraph, describing how to configure services in a cluster environment.
El Proxy
As a part of a wider El Proxy documentation improvement, previously available under Event Processing, procedure of Enabling El Proxy now serves as an entry point to the El Proxy Configuration in the User Guide.
In order to reveal and explain the methods of how NetEye achieves data integrity and inalterability when providing the feature of log signing with El Proxy, all documentation covering security aspects was combined into a new enhanced El Proxy Security section. There you will be able to find details on
- How El Proxy achieves secure logging by authentically encrypting logs
- How El Proxy grants secure communication to safely send logs to Elasticsearch, preventing data breaches
- Which healthchecks and error handling strategies assure that the blockchain is kept coherent.
Alyvix
More details regarding the setup and configuration of the Alyvix nodes were added to the user guide. The new section explains in detail the procedure related to the authentication of the Alyvix nodes and links to the corresponding section of the official Alyvix User Guide.


