


31. 03. 2025
NetEye, Service Management

If you’re familiar with the NetEye SIEM module you probably also know El Proxy, the solution integrated into NetEye to ensure the integrity and inalterability of the logs produced by the SIEM module.
Since its introduction in NetEye, the only way to understand what El Proxy was doing was to inspect its logs, but as we know this is not an ideal solution for getting an overview of the behavior of any piece of software. This means that until now, El Proxy has been like a black box for most users, who may be have been wondering for example:
- Is El Proxy signing and processing all logs correctly? Or is it perhaps encountering some error?
- What is the workload in El Proxy? Are El Proxy and Elasticsearch keeping up with all the logs produced by the SIEM module?
To answer these types of questions we started introducing observability into El Proxy. In particular, we started with metrics, which will allow users to easily spot anomalies in the infrastructure and analyze the behavior of El Proxy over time.
The technologies involved in the process of exposing and visualizing El Proxy metrics in NetEye are:
- OpenTelemetry: used by El Proxy to generate the metrics and expose them via an HTTP endpoint using the Prometheus format
- Telegraf: polls the metrics from the HTTP endpoint and writes them to InfluxDB
- InfluxDB: stores the time-series metrics
- Grafana: visualizes the metrics via multiple dashboards installed in NetEye
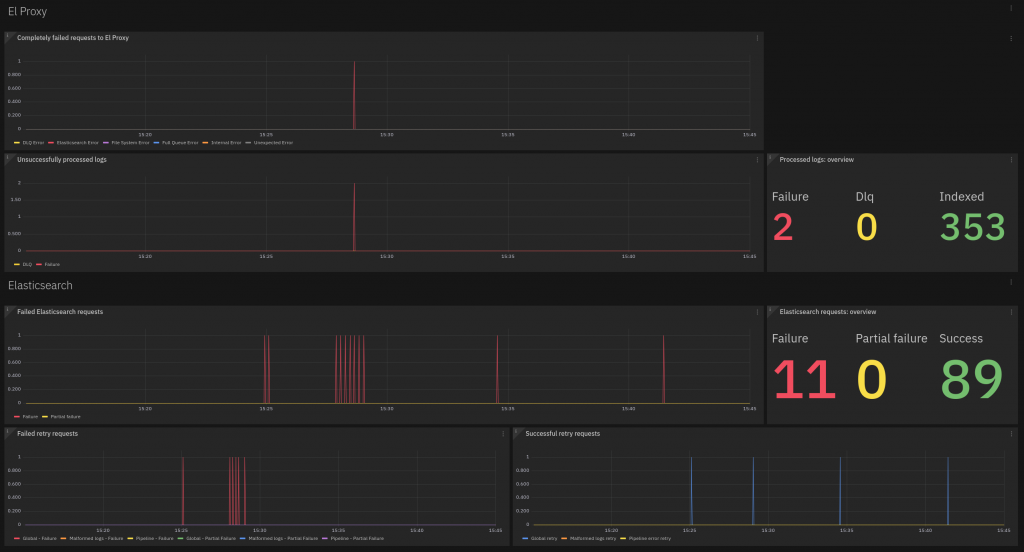
To design the metrics and the visualizations, we divided the metrics into two main topics. The first one is troubleshooting. For which users may ask: Did El Proxy fail to process some logs? If so, for what reason? Did it store logs in DLQ? If so, when?
To answer these questions we created the “Troubleshooting” dashboard, based on metrics constructed from these use cases.
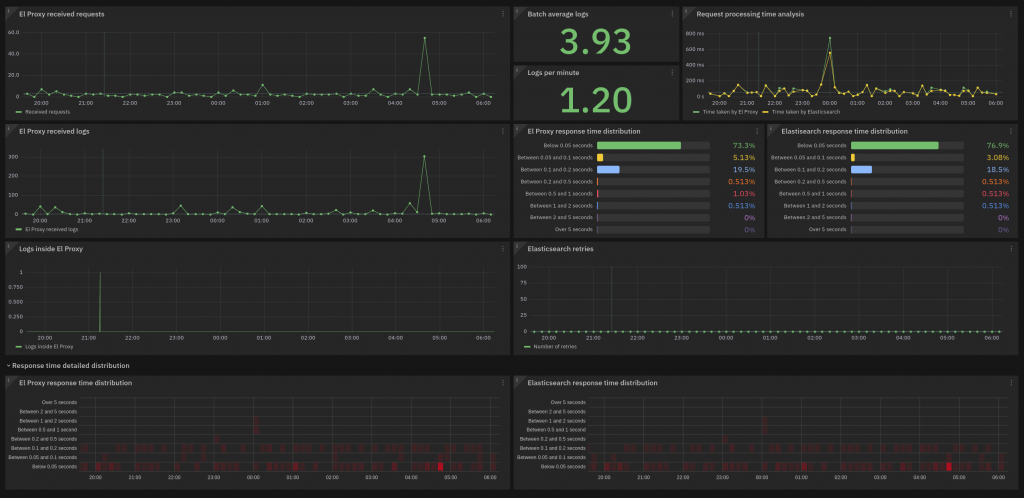
Another topic of interest is the performance metrics of El Proxy and Elasticsearch. Hence NetEye also provides a dedicated dashboard for this:
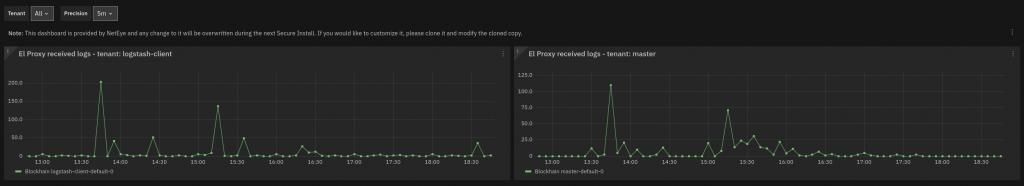
Finally, a third dashboard gives an overview of the number of logs generated by each Tenant present in the infrastructure:
We hope this first improvement on the observability of El Proxy will enable users to better and more easily get a grasp on the behavior of El Proxy. Any feedback is appreciated, please report it through the Wuerth Phoenix channels!
These Solutions are Engineered by Humans
Are you passionate about performance metrics or other modern IT challenges? Do you have the experience to drive solutions like the one above? Our customers often present us with problems that need customized solutions. In fact, we’re currently hiring for roles just like this as well as other roles here at Würth Phoenix.ext