


31. 03. 2025
NetEye, Service Management

Do you need a customizable dashboard to better track problems detected by NetEye? Here’s one:
WARNING
This dashboard does not take into account the user’s role and related permissions and it is intended for use by an administrator on an on-premise non multi-tenant installation of NetEye.
USE CASE
The standard Problems display (divided into two different menus, Hosts and Services) has often been found to be inefficient for situations where different operators need to be able to quickly detect problems and take charge of them.
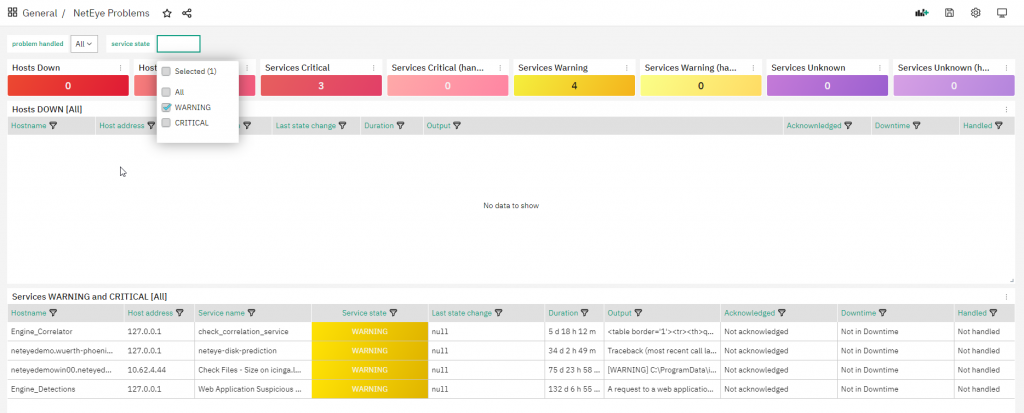
The idea behind the Dashboard shown above is to help problem tracking on NetEye with a new (and beautiful) view and the ability to quickly filter existing events.
Starting from the latest 4.20 release this dashboard is available with our NetEye Extension Packs, but you can also try it on our NetEye Demo system as well as your own NetEye implementation.
This dashboard can help you by showing a quick summary of all problems (hosts down, services in critical, etc…) and two different tables focused on host and service problems.
The Hosts table shows hosts in the DOWN state, giving you the ability to filter for Handled/Not handled problems (Icinga uses the term “handled” for those objects that have an active acknowledge or downtime).
The Services table shows services in WARNING and/or CRITICAL, giving you the ability to filter problems with:
- Problem handled filter: Handled/Not handled/All
- Service state filter: WARNING, CRITICAL, All
Finally, each displayed host or service can be selected and via a link you will be redirected to the standard NetEye interface with focus on the selected problem.
How to Import the NetEye Problems Dashboard
Before downloading and importing the dashboard, ensure Grafana has access to the Icinga Database by creating a properly configured MySQL Data Source (if it doesn’t already exist):
- Access the DBMS and create a user having
SELECTprivileges on the Icinga Database - Add a new MySQL Data Source to Grafana that connects to the DBMS using the user created in step #1
As already shared by my colleague Rocco Pezzani in his latest post we can proceed as follows using a bash script.
Just remember to set a proper password in the MYSQL_PASSWORD variable. The Data Source name is mysql-icinga2.
MYSQL_USERNAME='icingareadonly'
MYSQL_PASSWORD='<Change Me!>'

. /usr/share/neteye/scripts/rpm-functions.sh
. /usr/share/neteye/secure_install/functions.sh
. /usr/share/neteye/grafana/scripts/grafana_autosetup_functions.sh

cat << EOF | mysql
CREATE USER '${MYSQL_USERNAME}'@'%' IDENTIFIED BY '${MYSQL_PASSWORD}';
CREATE USER '${MYSQL_USERNAME}'@'localhost' IDENTIFIED BY '${MYSQL_PASSWORD}';
GRANT SELECT ON icinga.* TO '${MYSQL_USERNAME}'@'%';
GRANT SELECT ON icinga.* TO '${MYSQL_USERNAME}'@'localhost';
FLUSH PRIVILEGES;
EOF

datasource="mysql-icinga2"
datasource_type='mysql'
mysql_host="mariadb.neteyelocal"
mysql_port=3306
db_name="icinga"
grafana_host="grafana.neteyelocal"

datasource_data='"name":"'${datasource}'","type":"'${datasource_type}'","host":"'${mysql_host}':'${mysql_port}'","access":"proxy","database":"'${db_name}'","user":"'${MYSQL_USERNAME}'","password":"'${MYSQL_PASSWORD}'"'
create_datasource "${datasource}" "${datasource_data}" "${grafana_host}"
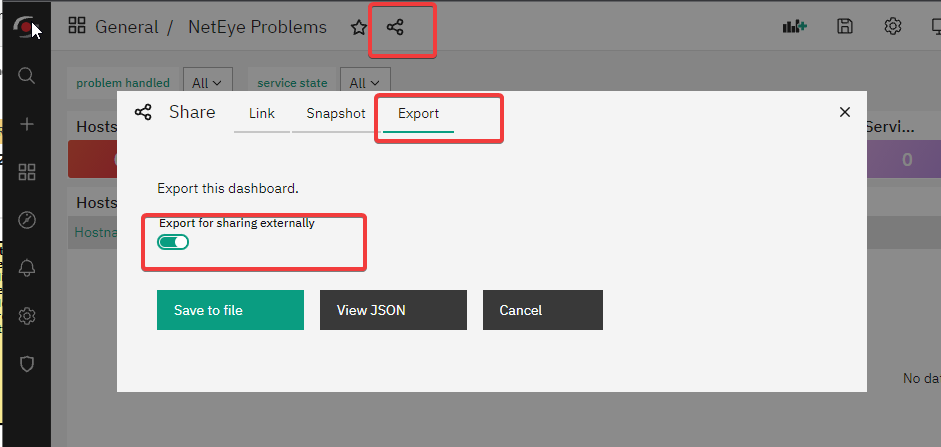
Now you can freely export the dashboard from our NetEye Demo environment: just access the Dashboard, click on Share dashboard or panel link and select the Export tab. Next, choose the format for your link after selecting Export for sharing externally.
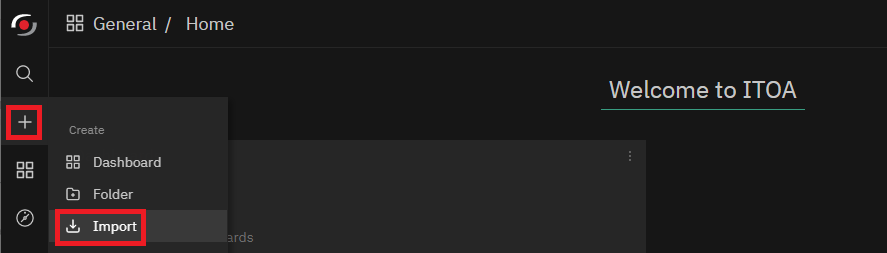
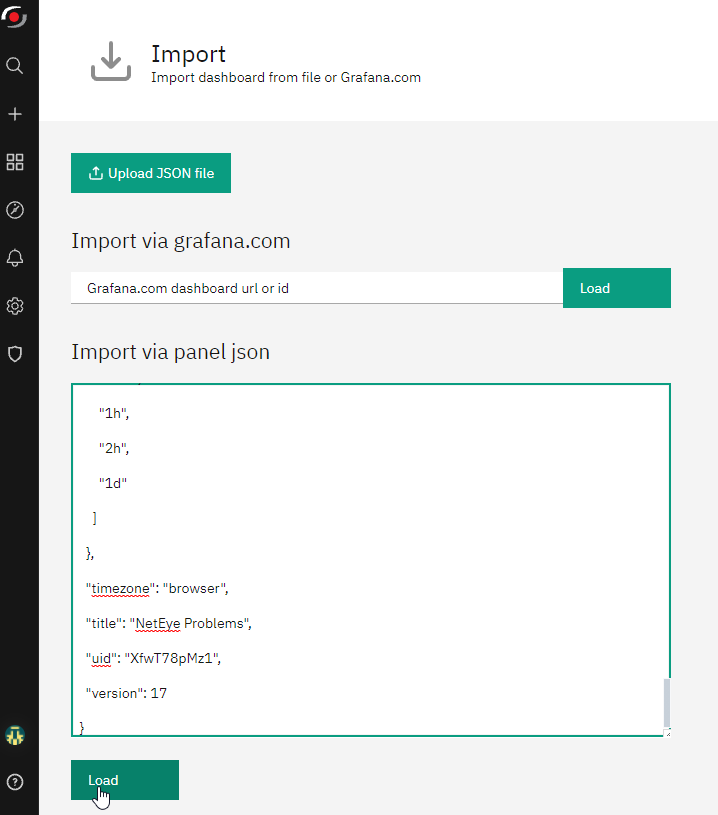
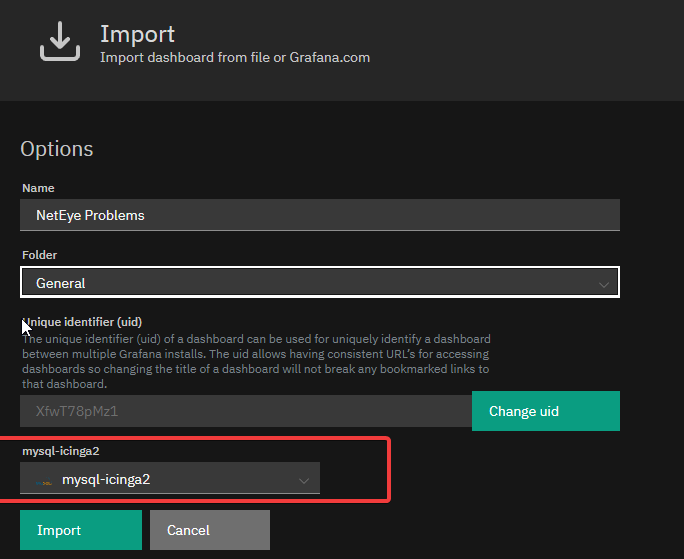
Next, you can go to your own NetEye’s ITOA and Import the new dashboard.

Giuseppe Di Garbo
Consultant at Würth Phoenix
Hi everybody. I’m Giuseppe and I was born in Milan in 1979. Since the early years of university, I was attracted by the Open Source world and operating system GNU\Linux. After graduation I had the opportunity to participate in a project of a startup for the realization of an Internet Service Provider. Before joining Würth Phoenix as SI consultant, I gained great experience as an IT consultant on projects related to business continuity and implementation of open source software compliant to ITIL processes of incident, change and service catalog management. My free time is completely dedicated to my wife and, as soon as possible, run away from Milan and his caotic time and trekking discover our beautiful mountain near Lecco for relax and lookup the (clean) sky.
Author
Latest posts by Giuseppe Di Garbo
28. 03. 2025
Atlassian, Service Management
Effortless On-Call Management with Jira Service Management
20. 12. 2024
Atlassian, NetEye, Service Management
Managing Alerts with JSM: Focus on Incident Management (Part 2)
22. 11. 2024
Atlassian, Service Management
Managing Alerts with JSM: Focus on Incident Management (Part 1)
27. 06. 2024
ITOA, NetEye, Unified Monitoring
Streamlining Icinga Director with Grafana
09. 05. 2024
NetEye
How to Customize NetEye Reports for Your Brand