Alerting on NetEye SIEM: Tornado Webhooks and Smart Monitoring (part 2)
In my previous post I showed you how to make your own alerts on NetEye SIEM by using the Elastic Watcher and Alerts and Actions features. But if we work in production environments, what we really need is an alert that can go directly to NetEye’s Monitoring Overview.
How can we manage SIEM alerts and display them on NetEye Monitoring? Tornado provides us with a quick solution to do this through its wonderful Webhook Collector executor.
Starting from our example of Alert on Beats Agent Fails, today we want to show the alert as a Service Check on each host where the Agent is deployed, under the NetEye Monitoring Overview.

Create the Tornado Webhook Collector
First of all let’s go to /neteye/shared/tornado_webhook_collector/conf/webhooks/ and, following the Tornado Webhook documentation, create a new collector for Elastic Alerts like this one:
{
  "id": "elastic",
  "token": "123456",
  "collector_config": {
    "event_type": "${type}",
    "payload": {
      "source": "${host}",
      "service": "${service}",
      "message": "${event}"
    }
  }
}
The ID and token are necessary to avoid unwanted and unauthorized webhooks.
The collector_config is used to parse and ingest the JSON field that is sent from the Watcher. The event_type is the key we use to match our Watcher. The other fields are parameters that make up the payload.
After that, we need to restart the Tornado Service. From that moment we can begin sending all the webhooks we want.
Add the Webhook Action to the Watcher
Now we need to add the correct action to the Watcher we created before (see my previous post). In this action we’ll also use the foreach field, setting the correct hostname of our NetEye installation.
Note: It’s important to set the correct ID and token parameters, otherwise Tornado won’t authorize the communication.
 "hook-tornado": {
      "foreach": "ctx.payload._value",
      "max_iterations": 100,
      "webhook": {
        "scheme": "https",
        "host": "neteye4.wp.lan",
        "port": 443,
        "method": "post",
        "path": "/tornado/webhook/event/elastic",
        "params": {
          "token": "123456"
        },
        "headers": {},
        "body": """{"type": "agent-beats-fails", "host": "{{ctx.payload.host}}", "service": "{{ctx.payload.type}}","event": "CRITICAL - No event received from Beats Agent in the last {{ctx.metadata.window_period}}"}"""
      }
    }
In the body field we can write some JSON that will be taken and parsed by our Tornado Webhook Collector. Here’s a quick explanation of the most important JSON fields:
- the type is the name of the watch job (necessary to be recognized),
- the host is the hostname of the host on which the Beats Agent runs,
- the service represents the Agent’s type name,
- the event contains the message output we want for this alert.
Note. A useful tool to check that the JSON’s body syntax is correct is https://jsonlint.com/
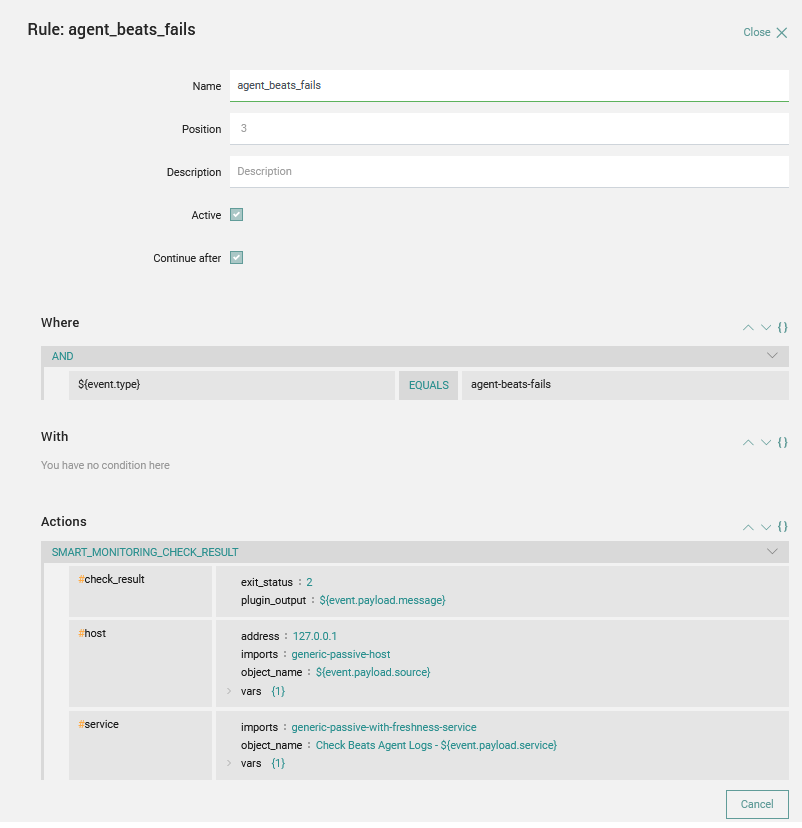
Make the Smart Monitoring Check (Tornado Rule)
The last, but most important, thing to do is create the Tornado Rule that keep in charge the JSON results from the Webhook Event Collector.

The rule is quite easy:
- The condition match is the
event.typefield like what we set as the type of the webhook (agents-beats-fails) - The action is a Smart Monitoring Check Result that is composed of:
check_result: Represents the Icinga exit status and output for our check and will be populated with the event field of the webhookhost: This is the target of our check; the key of the check is theobject_namefield that correspond to the hostname in Icinga and the host of our webhookservice: In this case the object_name is the service that we create for this specific check. We’ll put a human name on the service (Check Beats Agent Logs) and attach the name of the relative beat Agent (like filebeat, auditbeat, etc.). Then we’ll use generic-passive-with-freshness-service as a template that lets us reset our service toOKif no alerts come in within a specific time window (to better understand this concept please refer to this post)
Note: if the host or service doesn’t exist, then Tornado will try to create one for us using the specific values set on the action.
Now we have a good alert that will arrive at the Monitoring Overview, and that follows the correct method for Notifications on the NetEye ecosystem.
This approach could be useful for many different use cases on a production environment, so enjoy NetEye with Tornado and Elastic Watcher & Alerts and Actions, and share your experiences and needs with us.


