Release Date: July 31, 2020
Welcome to version 4.13 of our NetEye v4 Unified Monitoring Solution.
The complete changelog, which includes all fixed issues, can be generated on demand by following the instructions in the updated NetEye documentation.
To begin the upgrade, please follow the instructions in your current NetEye version at User Guide > Upgrading and Updating.
New Features
Monitoring | Problem View Filter
From this release, we have introduced the Custom Problem View module that allows you to filter the monitoring objects that are shown in the Problems section. This customization can be done from Configuration > Authentication > Roles.
Monitoring | Icingaweb2 Module Host2servicedetailview
With enabling of this new module, an admin can change the navigation behavior from host to host detail, to host to service details for all users. When this module is enabled, each user can directly drill down from the host overview to the services view of a specific host with a single click and see all the services associated with it.
Cluster | Load balancing
This feature introduces NGINX to allow the deployment of load balancing, reverse proxying, and proxy webserver on a NetEye 4 cluster.
To improve the performance in a cluster and to distribute the load across all nodes, we configured NGINX to load-balance all the incoming requests to Elasticsearch.
We also wrote a step by step procedure in the user guide to guide users in the set up and activation of the load balancing functionality of the Logstash incoming requests.
SLM | Custom SLM Report layout
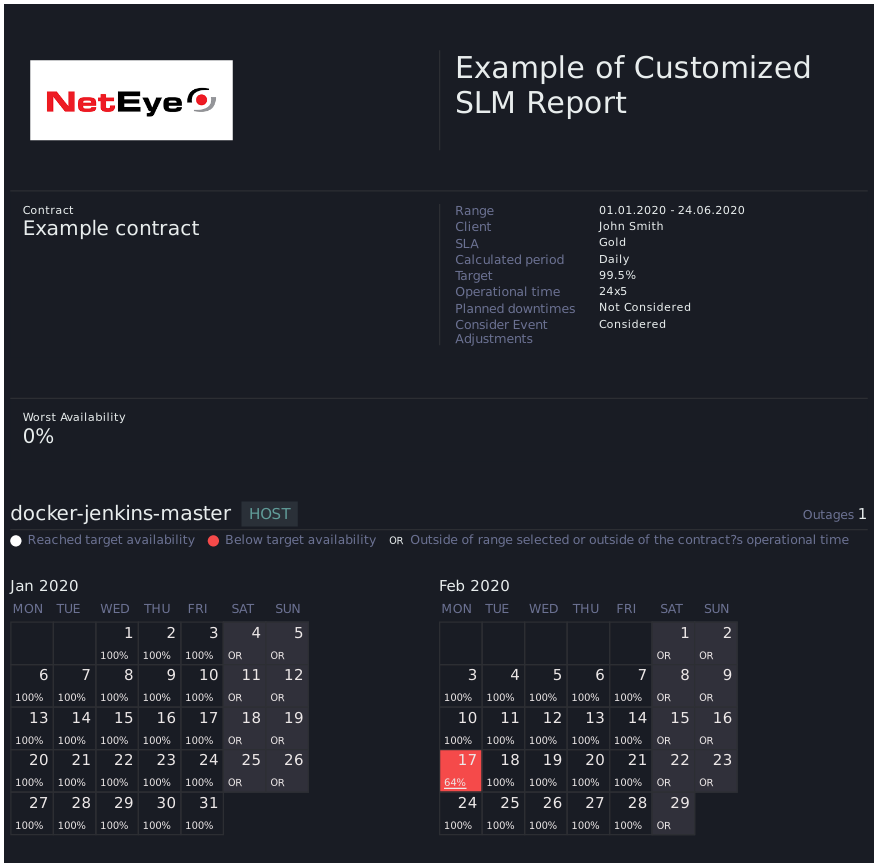
It is now possible to customize the layout of the SLM Availability Reports on a per-customer basis, allowing therefore every customer to receive reports with a unique, tailored layout.
Custom layouts can completely substitute the NetEye default layout, or change only parts of it. For example, you may want to change all the colors and fonts throughout the report, or you may want to only modify the header of the report for introducing a custom logo.
The customization can be achieved by modifying HTML and CSS files on the file system, and by assigning each customer to a custom layout from the GUI of the SLM feature module.
An How-To for achieving the report customization is present in: User Guide > Service Level Management > How To Create a Customized Theme For SLM Availability Reports. Below you can also see the rendering of a working example of a customized SLM report, which will be pre-installed in NetEye.

Tornado | Monitoring Executor
Tornado is now able to set passive check results on Icinga Objects, and transparently and dynamically create those objects in the Icinga monitoring environment if necessary.
Moreover, the objects created by the new Tornado Monitoring Executor will also be created in the Icinga Director, to allow for a fully integrated management of hosts and services.
VMD | Tornado Integration
In NetEye 4.13, we integrated the icingaweb2 module vSphereDB with Tornado, such that Events and Alarms can be matched by Tornado Rules, and trigger Tornado Actions.
This will allow you to dynamically monitor Virtual Machines by creating them on the fly using the new Monitoring Executor and set passive check results for both Virtual Machines and vSphere Hosts
Monitoring – Default retention
In this release, we have introduced retention policy on Icinga2’s Icinga Data Output (IDO) DB to 365 days, which can later be changed. All Icinga 2 data that are stored in the MySQL database will be deleted after the configured retention time. This setting is automatically applied on new installations, while in existing installation it must be configured and applied manually.
Improvements
GeoMap
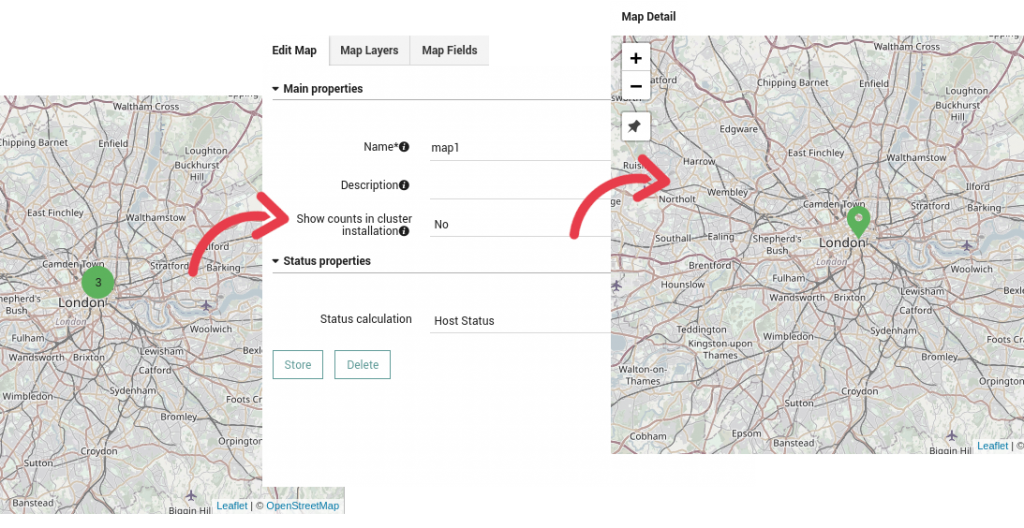
The map visualization in GeoMap can be customized to choose either a dedicated cluster icon or a simple marker for representing grouped hosts.

Tornado GUI
In this release, the Tornado GUI underwent major UX Improvements. Notifications have been improved, and most notably, you will now get feedback for any permanent actions executed from the User Interface. Error Reporting has been improved as well, giving more detailed, and easier access to the pitfalls, directly from the Notification Area.
In the testing mode, the “Clear” button has been renamed to “Clear Form” and a second “Clear Result” has been added to make the intent more intuitive.
In this release, Tornado translations have been integrated with NetEye’s standard translation system. The Tornado UI will be available in the three languages English, German and Italian.
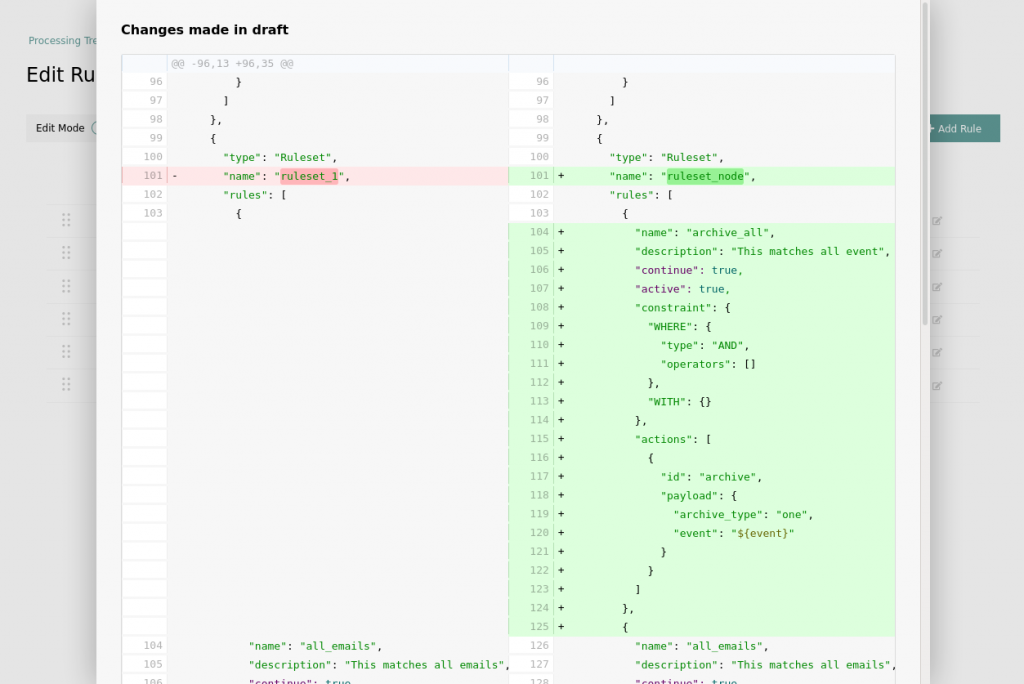
When editing a configuration Draft, Tornado UI now gives you the possibility to compare this draft to the configuration used in production. You can thus check all changes in one screen before deployment.

The Icingaweb2 Module Tornado is now integrated with the Icingaweb2 Module Auditlog. The action of a user deploying a new configuration will automatically be recorded in the Auditlog module. The applied changes can therefore be easily checked in System > Auditlog, by clicking on the corresponding entry in the table.
The Tornado UI is built using the NetEye Design System Framework. The Design System integrates now natively the Bootstrap Vue component library.
Module Updates
InfluxDB upgrade to version 1.8.0
We upgraded InfluxDB to version 1.8.0, which brings the new flux language as a stable feature. After the upgrade you can start using it out of the box. This release is also API compatible with InfluxDB 2.
Breaking changes
The Elastic Logstash user pre-configured in NetEye will be deprecated and only authenticated via certificates and not via basic authentication. If you used the “logstash” user in your customized Logstash output filters please migrate your settings (see the User Guide > Upgrading and Updating > Upgrade from 4.12 to 4.13 or Cluster-Specific Upgrade from 4.12 to 4.13).


