Icinga DSL: How to Enrich SIEM Logs with Icinga Custom Vars
Over the past few months, I’ve received multiple client requests to export custom fields (custom variables or data lists) present in Icinga Director in order to enrich logs on Logstash or to make specific changes to the indexing process.
The solution that I am going to explain in this article uses the Icinga DSL check command to export custom fields to a file that can be used by Logstash with the translate filter plugin.
What is Icinga2 DSL?
The Icinga DSL (Domain Specific Language) is essentially a wrapper for the Icinga API that allows you to do everything that you can normally do with API calls, like configure additional hosts, services, notifications, dependencies, etc.
Icinga DSL can be used like a full programming language.
In this article I would like to show you how to write a script using the Icinga DSL check command.
This is an interesting NetEye feature that lets you execute different operations on Icinga Objects, like extracting data from Icinga Director and manipulating their output.
Here you can find a list of building functions that can be called via DSL: https://icinga.com/docs/icinga2/latest/doc/18-library-reference/
A Helpful Use Case for MSSP Customers
The most important thing for an MSSP customer is to guarantee the separation of logs that come from different customers. Basically, we need to have a different index on Elasticsearch for each customer registered on a NetEye system.
To do this we can add a custom variable to each host in our Icinga Director. This variable has to be populated with the customer name as part of the index name. The details on how we solved this is explained through the following 6 steps:
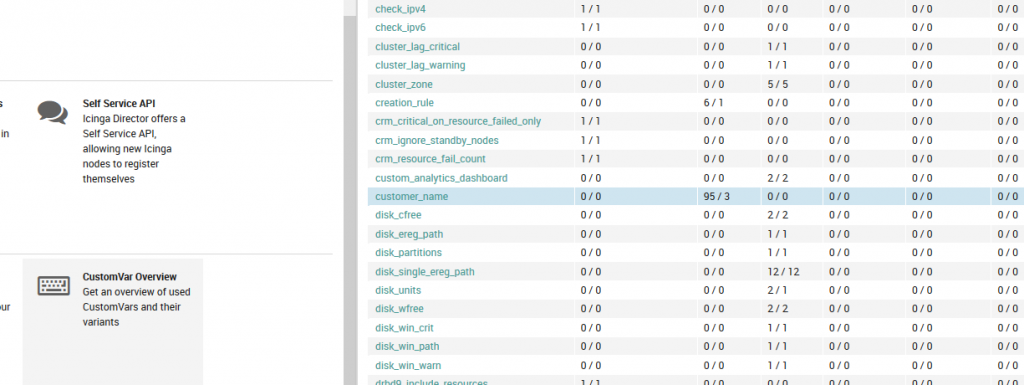
1. Populate the custom var on NetEye hosts: add a custom variable named ‘customer_name at Icinga Director > CustomVar Overview
2. Create a script on PluginContribDir: create a bash script that takes as input 2 parameters: the result of a DSL Query and the destination file path where it should be written to
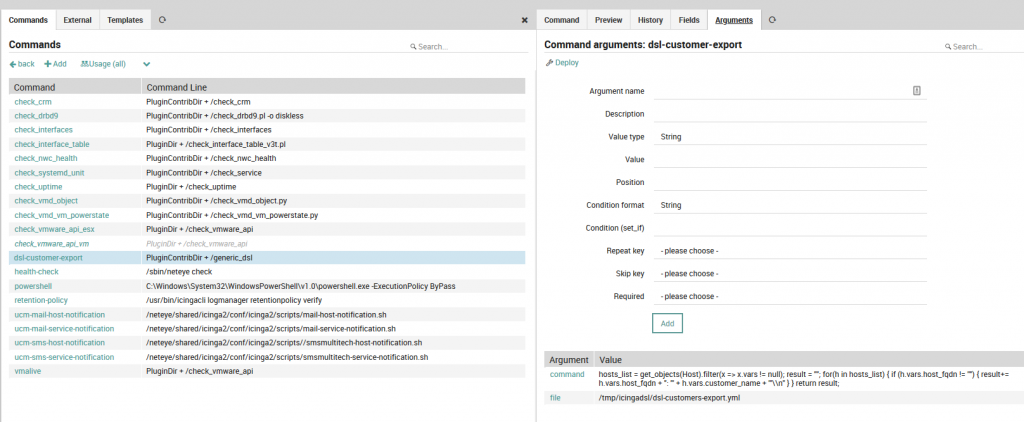
3. Add command: create the command invocation for the bash script at Icinga Director > Commands and add a new “Plugin check command” type named ‘dsl-customer-export’ with the two arguments needed for the script:
- The command: choose the type “Icinga DSL” – in our example I’ve extracted the customer_name vars from every host and saved the result on a key-value list (hostname: ‘customer_name’)
- The output file path: this must be a full file path and must be writable given the permissions of the user who runs the script (‘icinga2‘)
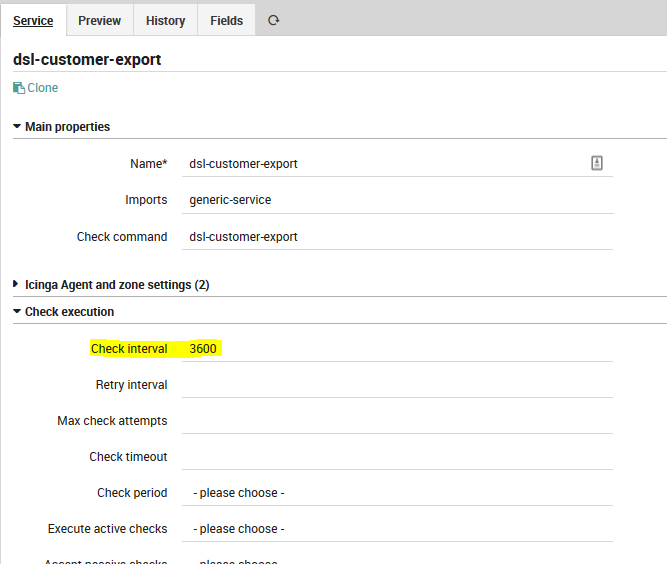
4. Add a service template: create the Service Template in order to call the ‘dsl-customer-export’ check command created in Step 3 – in my example I specified the check interval for every 3600 sec (1 hour)
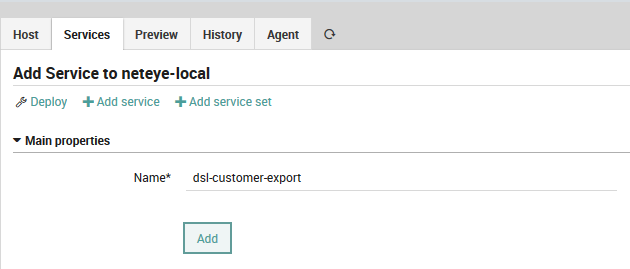
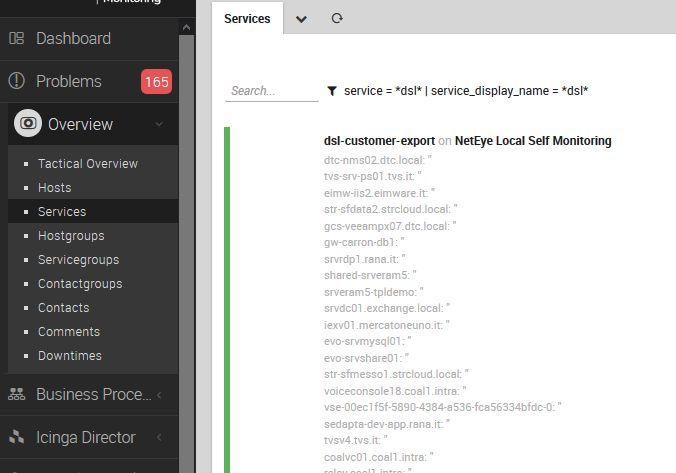
5. Add a service to neteye-local and run the check: create the service using the template made in Step 4 and check the result at Overview > Services. Seeing the green status bar and the readout of all the key/value pairs is a great and easy way to verify that the result is working and is aligned with your expectations.
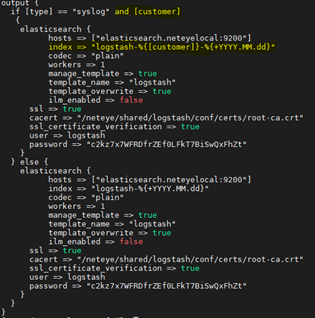
6 Make Logstash configuration changes: under /neteye/shared/logstash/conf/conf.d/ you will need to:
- Create a new filter that adds the customer field based on the name of the host sending the data

- Modify the output filter to write the customer logs to a specific index that contains the customer name
Save, restart the logstash service, and game over!
To see the results, open the Log Analytics dashboard and go to the Discover tab. Here you will see the new customer field populated with each log’s entry, and the logs written to different indices.
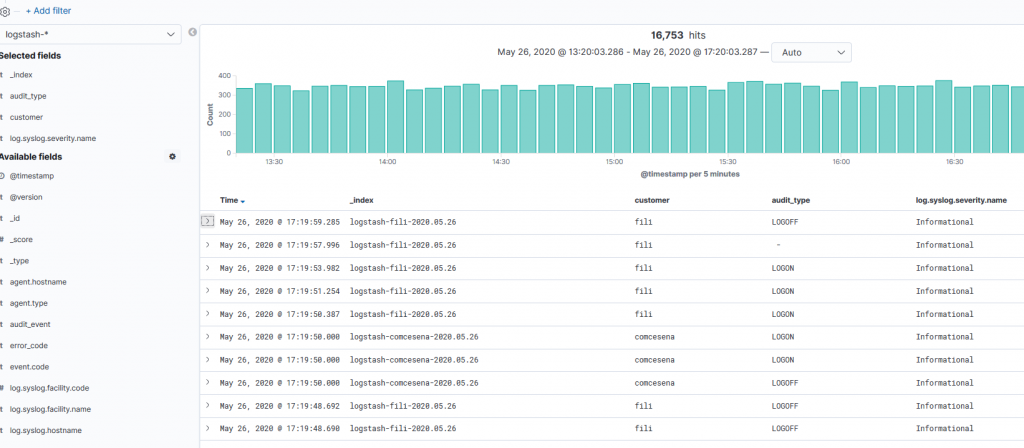
Note: We have the same Timeperiod in which the variable is not up to date, due to the check interval of the Service Template (in our example it’s 1 hour)


