NetEye and Predictive Monitoring
We often hear about predictive monitoring, alongside the words machine learning and anomaly detection.
Today, just as in the past, the “data” is invaluable and what we will try to do here is use simple data we can easily collect (data which individually might have no value) and apply Machine Learning techniques in order to identify anomalies, and then be able to make our monitoring predictive and not just simply reactive.
It’s possible to apply what I will describe in this article to many fields. I believe that in a monitoring system, one of the checks that is often subject to false positives is the verification of disk space, especially considering the criticality that could arise from quickly filling up the partition of a production server.
Scenario 1
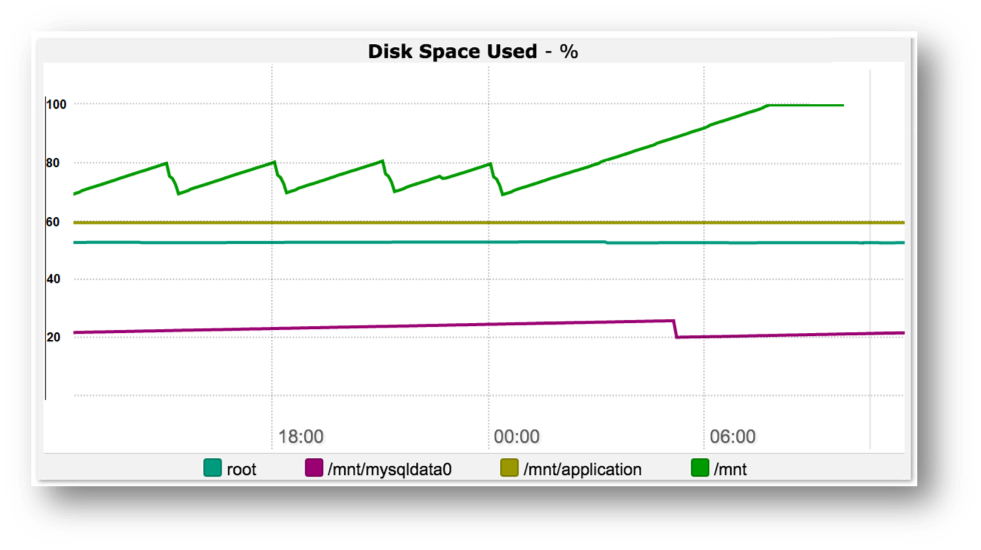
- A server has a 100GB partition. This generally has a “sawtooth wave” trend since most log retention policies enforce compressing certain files and deleting old logs. If these log retention policies are interrupted, the partition continues writing data and within a few hours it reaches 100%.

An alert was sent a few minutes before the /mnt/mysqldata0 partition was completely filled. No one took charge of the problem until the service provided by the server unfortunately stopped working. How many of you would like to have been notified several hours earlier? I imagine many of you would.
Scenario 2
- A server has a 1TB partition, with a positive, linear trend of several MB per day.
The alert threshold is set to 90%, meaning that the system will send an alert (via email, SMS, Telegram, Slack, etc.) as soon as this partition has less than 100GB free. How many of you would like to only be alerted3 yearsbefore this partition fills up? I imagine few of you would.
A prediction algorithm could definitely help us here, in the first case to limit the damage, while in the second case advising us a few weeks beforehand rather than a few years before.
How Can We Move to a Prediction Point of View?
To do this it is necessary to imagine a completely different kind of alert threshold. Generally, we talk about percentage-basedthresholds, such as: “Warn me when the partition is 90% full“, or “Warn me when there is 10% free space“. Now we will talk about time-basedthresholds.

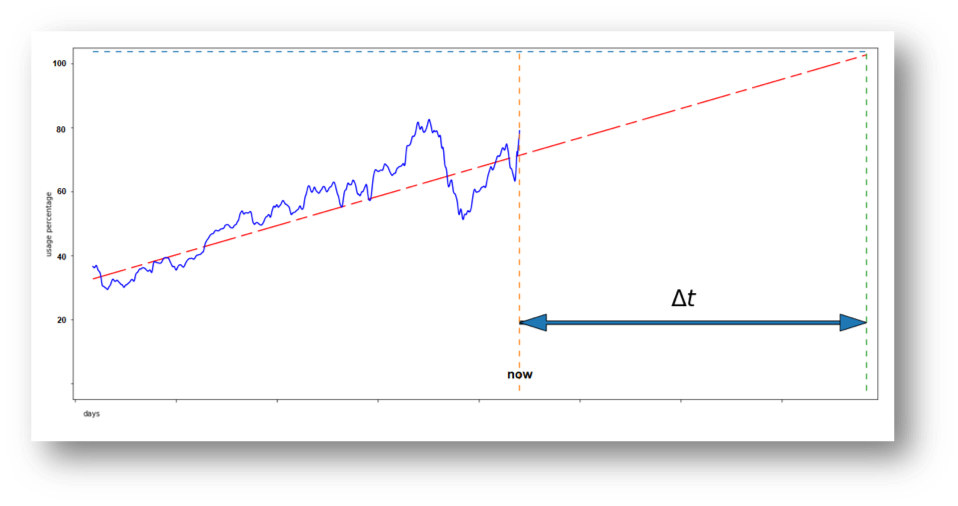
The data pictured in the graph above shows an example of how full disk space might be over time.
By tracing the line that best approximates this trend (linear best fit, or linear regression), it is possible to calculate a value for Δt that appears to be the amount of time left before this line intersects 100% (a saturated disk partition).
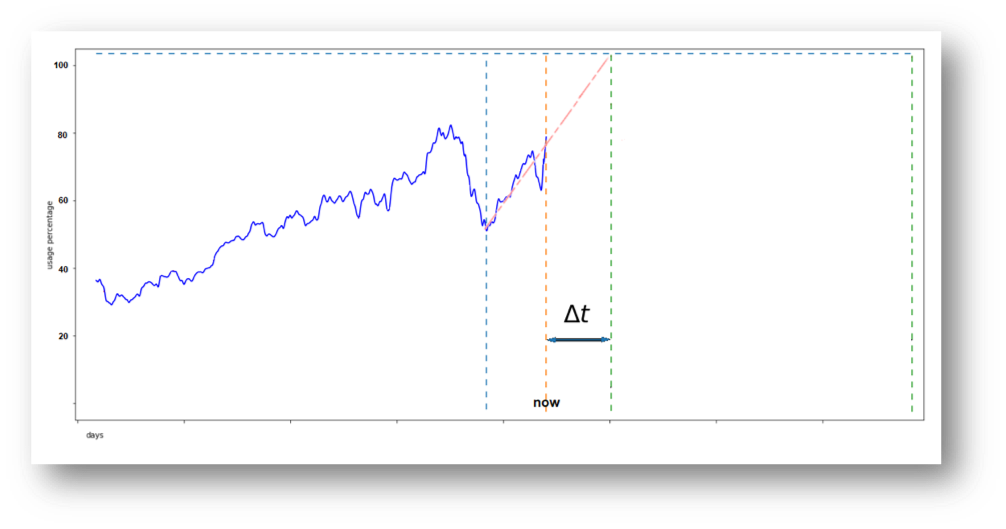
Clearly if the data taken into consideration for the trend line was over a smaller interval, we would have a different intersect value.

In this second example, we have a narrower Δt since a different data subset is taken into consideration.
It is therefore important to define a parameter that identifies the amount of previous data to be taken into consideration:
- Longer period = The check will be less proactive
- Shorter period = The check will be more proactive check and take less time to execute, but it will be subject to false positives
In this case, I believe that a range of several hours is acceptable, although it also depends on the partition’s normal trend.
By implementing the plugin described above, we were able (in a production environment) to identify anomalies days in advance (e.g., out-of-control log file writes) while the partition was still 50% occupied.
Running on the NetEye System
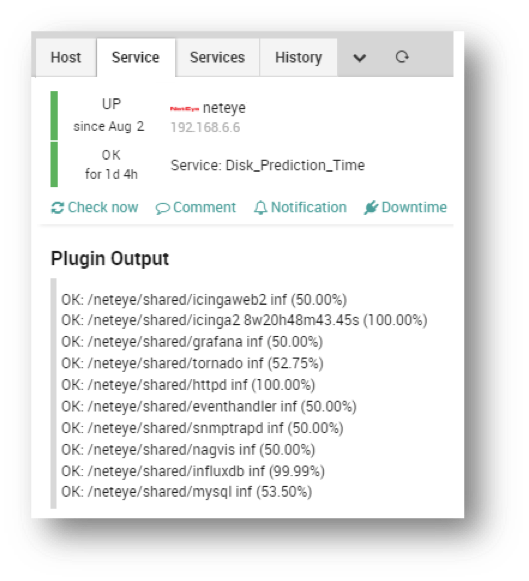
Once the check is implemented, the result will be the following:

In this order, we have:
– Partition status (OK/Critical/Warning – Based on time thresholds)
– Name of the partition
– Estimated time to reach the threshold (i.e., full disk, where inf = infinity, w=week, d=day, etc.)
– Percentage of confidence (where a high value means “I am reasonably sure that the prediction is correct”)
Conclusion
This “magic” check will save you from many bad situations and will move your monitoring system from reactive to predictive. Sure, your boss and his boss will appreciate this new approach. It will add significant value and continuity to your business operation and, why not, help you stay a little bit more relaxed at night!
You can find more information about our plugin, the Bayesian/Linear regression and RANSAC method on Tommaso Fontana’s GitHub.


