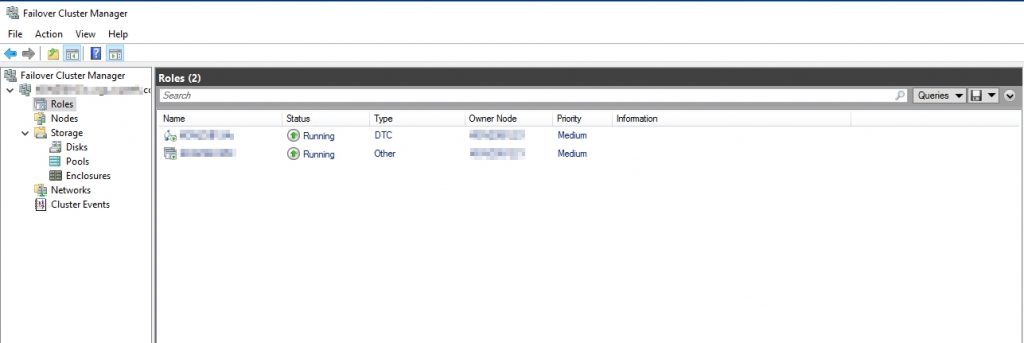
In today’s critical IT environments, setting up a cluster represents a common approach to increasing the availability of services and applications. The concept of clustering is a set of independent computers that work together, where if one node fails another node automatically begins to provide services through a process known as failover.
To make sure we’re on the same page, let me explicitly introduce the concepts of a Cluster based on Microsoft’s infrastructure:
- Cluster Node: The servers that form part of the cluster are referred to as nodes and are connected together by means of network communications.
- Cluster Groups: Services often depend on other resources such as storage, IP addresses and the network, these resources are grouped together in a cluster group. Failover occurs at the cluster group level, so services and all dependent resources are moved together to the alternate node on failover.
- Cluster Resources: The individual resources are bound together in a cluster group.
Extended documentation regarding the concepts, deployment and management of a cluster is provided on Microsoft’s site: https://docs.microsoft.com/en-us/windows-server/failover-clustering/failover-clustering-overview
The aim of this blog is to introduce one way to monitor a recent generation Microsoft Cluster. This kind of environment might be monitored by fetching relevant information via PowerShell commands or by accessing WMI objects (you can find official resource links at the end of this article).
The following approach to cluster monitoring has been tested on a cluster environment built on Microsoft Server 2012, but should also apply to more recent generations. The monitoring approach is to use a PowerShell command to fetch status information related to the single cluster nodes, the cluster group and again the single cluster resources organized within the group(s).
Monitoring the Cluster Objects
To avoid reinventing the wheel, it is worth taking a look at what the monitoring community has provided. I found a simple, but in my opinion efficient, script called “Nagios_Cluster.ps1” created by Martin Matuska and published on gist.github under his alias hpmmatuska (Link: https://gist.github.com/hpmmatuska)
The script can be used to perform the following tasks:
- Monitoring the state of cluster nodes:

- Monitoring the state of the cluster group’s resources:

Integration in NetEye
Download the script from gist.github and copy it to all of the nodes of your cluster. We will implement monitoring in NetEye by calling the PowerShell script on only one active cluster resource IP, but potential service relocation will force us to prepare the monitoring Agent on all nodes participating in the cluster.
Configuring the Monitoring Agent using NSClient++ or the Icinga2 Agent with NSClient++ embedded, and register PowerShell with a command such as this:
cluster_health = cmd /c echo scripts\\Nagios_Cluster.ps1 %ARGS%; exit($lastexitcode) | powershell.exe -command -
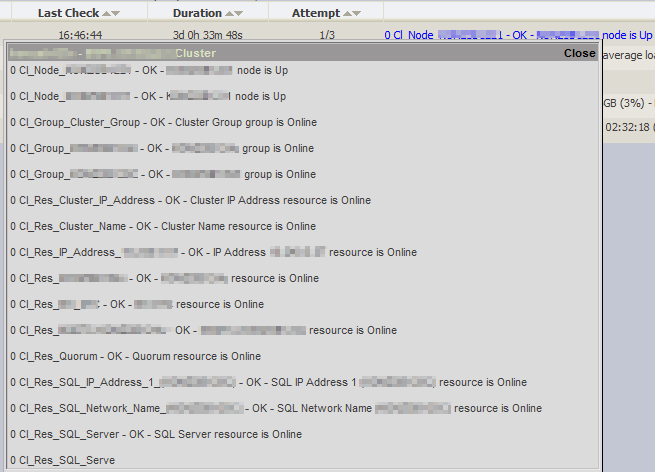
Once a suitable service definition has been created in NetEye 3 via NSClient++, or in NetEye 4 via the Icinga2 Agent, the result provides you with a status overview of the cluster nodes:
![]()
and additional details about the concepts described above:

Comments on the Script
The benefit of this script is monitoring the status of all cluster nodes, and being able to verify that all nodes have the status description “node is up”. The same applies to the iteration over all cluster groups and cluster resources, verifying that each have the status “Online” for groups and Resource respectively. The failure of any component would lead to a Warning, Critical or Unknown situation, depending on the severity attributed by the author to the event.
Concluding, I greatly appreciate the work of Martin Matuska (alias hpmmatuska) and would like to encourage all IT Operators to adopt, review and contribute to plugins and scripts provided by the wider monitoring community.
Resource links:
An introduction to Microsoft Cluster terminology:
https://blogs.msdn.microsoft.com/garyhope/2009/02/13/windows-failover-cluster-terminology/
Resource documentation of PowerShell commands for Server Manager:
https://go.microsoft.com/fwlink/?LinkId=135119
The Script Nagios_Cluster.ps1:
https://gist.github.com/hpmmatuska/bc94b9e087655391b251#file-nagios_cluster-ps1


Do we have any plugin to monitor ms sql DB cluster monitoring and MySQL innodb cluster monitoring plugins using Nagios.
If you prefer monitoring the cluster ressource this powershell should indicate the related ressources. If you need to monitoring sql server at application – level there are plenty of plugins on Nagios exchange (https://exchange.nagios.org/directory/Plugins/Databases/SQLServer) or even icinga exchange