Microsoft WMI Monitoring – Some troubleshooting advice
In my previous blog I introduced the concepts of agentless monitoring via WMI for Microsoft environments: from the preparation of suitable authentication credentials to providing some simple monitoring examples. In this blog I would like to add more details about specific checks, and the possibilities for troubleshooting if you have difficulty fetching the desired data.
First of all, you should be aware of the possibilities that WMI-based monitoring provides on Windows, and the scope of provided classes: As introduced in the previous blog, the user for WMI monitoring is authorized to access Objects within the “CIM V2” scope. This scope provides common system performance measurements such as CPU, memory, disk space, network and Event Log information.
This data can be easily accessed via built-in checks provided by the great check_wmi_plus.pl. Documentation can be found on the web page of the project, or by running “check_wmi_plus.pl –help”. But not all queries will be limited to objects from CIMV2, such as checkexchange.
Built-in checks:
checkcpu, checkcpuq, checkdrivesize, checkeventlog, checkfileage, checkfilesize, checkfoldersize, checkgroup, checkgroupuser, checklogon, checkmem, checknetwork, checkprintjob, checkprocess, checkservice, checkshare, checksmart, checkstartupcommand, checktime, checkuptime, checkuseraccount, checkvolsize, checkwsusserver
To run these checks, simply create a call like this:
./check_wmi_plus.pl -H myhost -u neteye_user -p secret_password -m checkdrivesize -a "c:" -w _Used%=90 -c _Used%=95
 OK - C: Total=94.899GB, Used=76.45GB (80.6%), Free=18.449GB (19.4%) |'C: Space'=82087526400B; 'C: Utilisation'=80.6%;90;95;
HINT: You can extend a partition filter to all partitions by using a wildcard: -a “.”
Troubleshooting WMI Calls
You might encounter errors when fetching data via WMI such as the following call that monitors network traffic on windows Servers.

When searching for the error “NT code 0x80041010” we already find some hints online that such objects do not exist: Example1 or Example2. In order to really prove this, we need to understand the Object’s class path. The simplest way is running the Plugins with the “-d” (debug) argument:

Now you get the Query executed via WMI-Client (wmic). You can try to perform a query like this directly from the command line to confirm this statement.

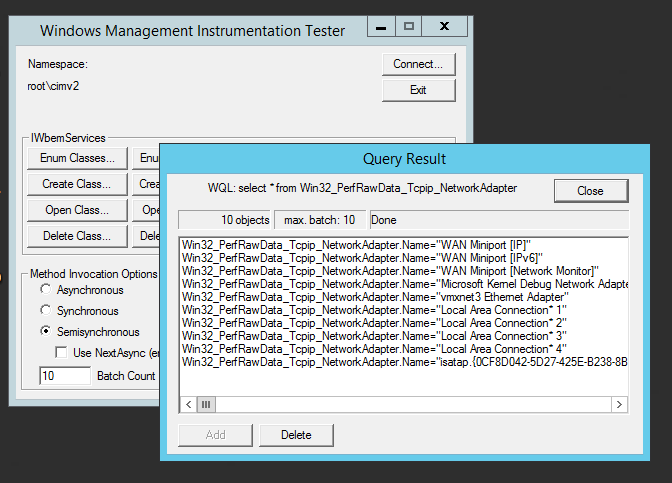
You can validate the Class structure of the CIMv2 Tree via a simple windows tool: wbemtest.exe
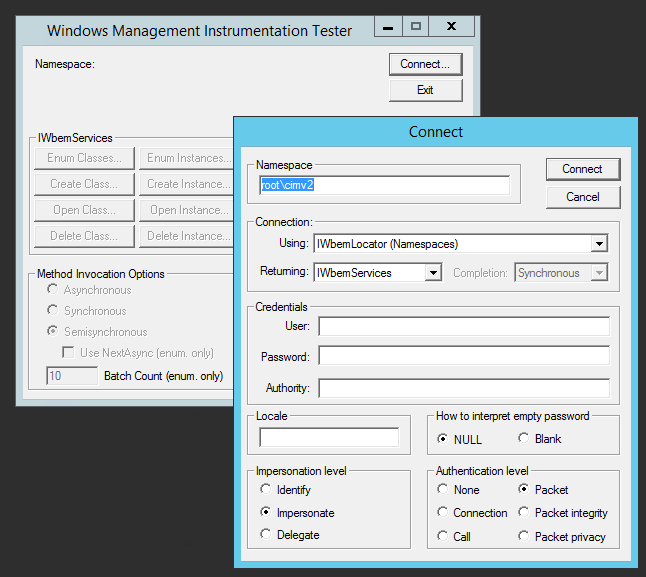
Let’s connect to a Windows 2008 R2 Server and verify the situation – Run the tool and “connect” to the “root/cimv2” namespace:
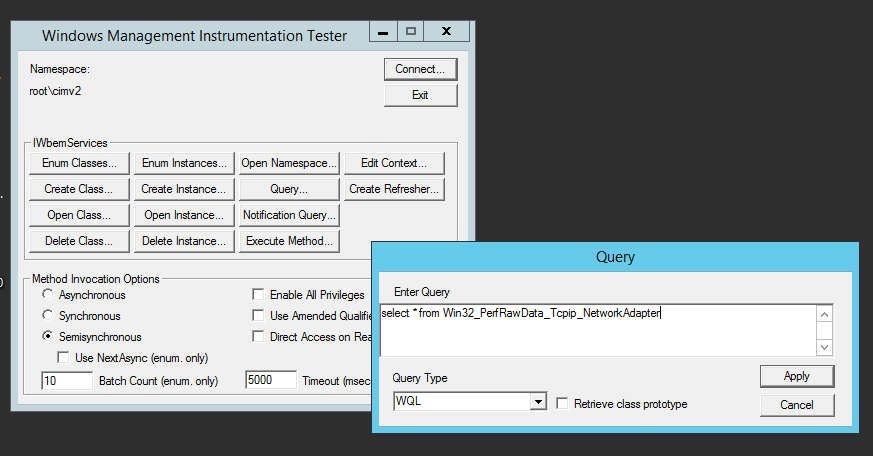
Now execute the same query as before via “wimc” (For simplicity, I’ve extended the select statement for all attributes):
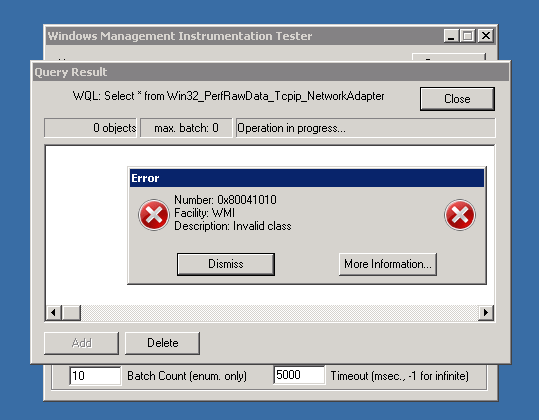
…and the result confirms the missing class object:
When switching to a Server 2016 machine, the CIM Classes provide data for this class, and the same query provides the list of network adapters:
Hiding authentication data from a command call
Further advice related to security is to hide your credentials from a command call by instead putting them into a configuration file. Not only might user names and passwords be visible from the monitoring status view (command call details), but also within the shell such as with the system command call history (e.g., running “history” over ssh).
To pack credentials into a configuration file, you should ideally provide a file within a NetEye cluster-ready path, such as /etc/nagios/neteye/plugins/wmi/:
cat > /etc/nagios/neteye/plugins/wmi/auth.conf
username=neteye
password=secret
domain=neteye.local
Now perform your monitoring calls by referencing your new auth.conf file:
./check_wmi_plus.pl -A /etc/nagios/neteye/plugins/wmi/auth.conf -H 1 -m checkeventlog -a checkdrivesize -a "c:" -w _Used%=90 -c _Used%=95
 OK - C: Total=94.899GB, Used=76.45GB (80.6%), Free=18.449GB (19.4%) |'C: Space'=82087526400B; 'C: Utilisation'=80.6%;90;95;
With this method I was able to troubleshoot multiple uncertain situations concerning WMI class information, and was able to hide authentication credentials from other users accessing the NetEye user interface via web.
A WMI monitoring profile for NetEye 3
Finally I want to provide you with some “getting started” monitoring configurations that you can load directly into NetEye 3 to perform OS – Health monitoring via WMI: CPU, DISKSPACE, MEMORY, PROCESSES/SERVICES and finally searches for events in EVENTLOG.
Here you will find a bundle of check_wmi_plus v. 1.63 checks that you can copy directly into /usr/lib/nagios/plugins/
NB: Please remember to adjust the “config_file” path in line 30 of check_wmi_plus.pl if you change the location of the etc/ folder containing the configuration files.
NetEye 3 Monarch with WMI service checks:
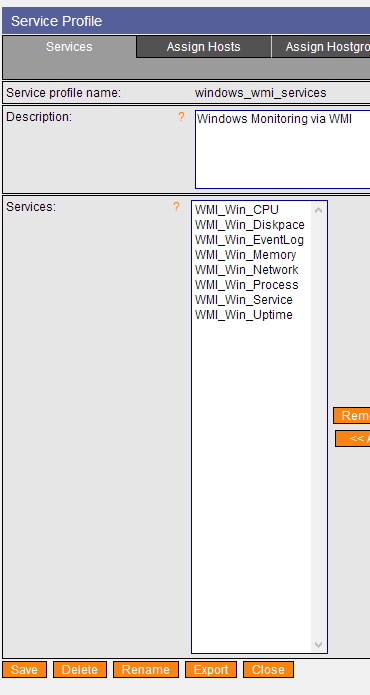
service-profile-windows_wmi_services
