Introducing Pagination for Grafana Scripted Dashboards
The new release of NetEye 4 brings with it the Grafana scripted dashboard concept.
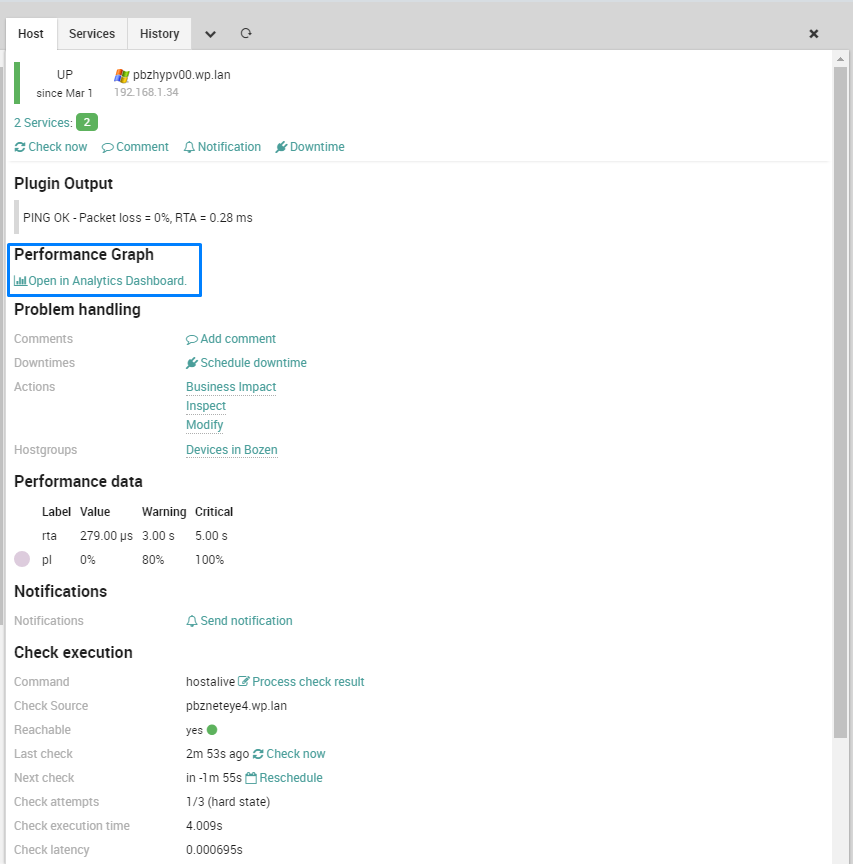
If you have lots of metric names, it can be annoying to have to constantly create new dashboards. But if they change in a defined pattern (e.g., new servers), you can use scripted dashboards to create those dashboards dynamically using JavaScript. In the Grafana folder public/dashboards/ there is a file named analytics.js. This file contains the structure of the dashboard, which you can access by clicking on the “Open in Analytics Dashboard” link in the host or service overviews.

NetEye 4 Analytics Module
Grafana scripted dashboards can greatly improve the user experience on NetEye 4 because they offer ready-to-use dashboards with a standard template for all metrics in your system. Unfortunately however, this kind of dashboard (with some limitations) is not always user-friendly because of the large number of graphs that must be shown on a single page.
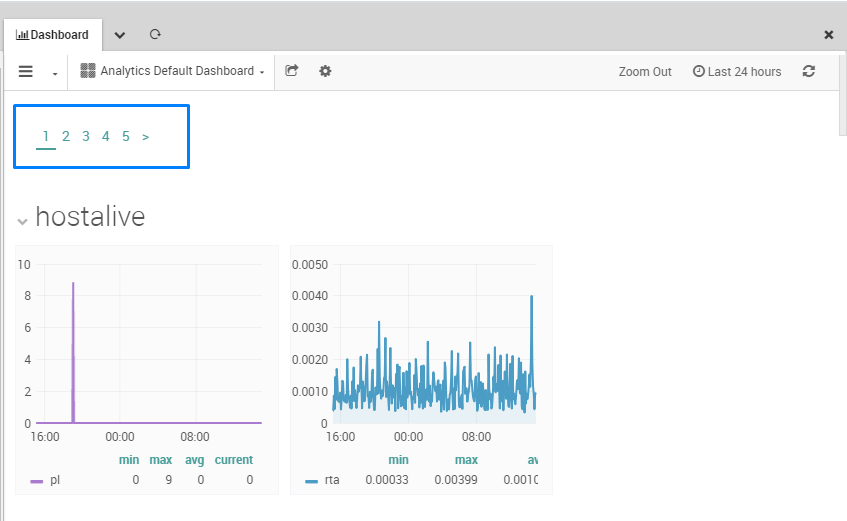
In order to avoid this unending series of panels and the resulting slowly loading dashboard, we introduced a really cool feature in our default analytics dashboard: pagination.
How to create a Grafana scripted dashboard with pagination
Let’s start from a basic scripted dashboard template. For our purposes here I chose an asynchronous template. You can find a basic example in the public/dashboards/ directory of the Grafana distribution. It should look like the following:
'use strict';
var window, document, ARGS, $, jQuery, moment, kbn;

return function(callback) {
    // Setup some variables
    var dashboard;

    // Initialize a skeleton with nothing but a rows array and service object
    dashboard = {
        rows : [],
        services : {}
    };

    // Set a title
    dashboard.title = 'Scripted dash';

    // Set default time
    dashboard.time = {
        from: "now-6h",
        to: "now"
    };

    var rows = 1;
    var seriesName = 'argName';

    if(!_.isUndefined(ARGS.rows)) {
        rows = parseInt(ARGS.rows, 10);
    }

    if(!_.isUndefined(ARGS.name)) {
        seriesName = ARGS.name;
    }

    $.ajax({
        method: 'GET',
        url: '/'
    }).done(function(result) {
        dashboard.rows.push({
            title: 'Chart',
            height: '300px',
            panels: [
                {
                    title: 'Async dashboard test',
                    type: 'text',
                    span: 12,
                    fill: 1,
                    content: '# Async test'
                }
            ]
    });

    // when dashboard is composed call the callback
    // function and pass the dashboard
    callback(dashboard);

    });
}
For pagination purposes you have to define two additional variables, besides the typical host-name/service-name.
var paginationPage = (searchForUrlParams('var-page') ? searchForUrlParams('var-page') : 1);
var paginationLimit = (searchForUrlParams('var-limit') ? searchForUrlParams('var-limit') : 50);
where searchForUrlParams is a useful function for retrieving parameters from the response to a get request:
function searchForUrlParams (paramName) {
    var result = null;
    var tmp = [];
    // array containing all search params
    var queryParams = window.location.search.substr(1).split('&');
    for (var index = 0; index < queryParams.length; index++) {
      tmp = queryParams[index].split('=');
      if (tmp[0] === paramName) { result = decodeURIComponent(tmp[1]); }
    }
    return result;
  }
In NetEye 4 Grafana runs on top of InfluxDB. Unfortunately for our goals, it has some limitations for ordering by a specific database column. In particular, the InfluxDB query language doesn’t have the order by clause. For this reason I recommend that you prepare all the data at once, querying for it via Ajax request, and then adding pagination afterwards.
Once you’ve gotten the array with data that will be shown in the dashboard, you can pass it to another function to sort the graphs and add pagination.
function sortAndLimit (perfs, paginationLimit, paginationPage) {
  var pagination_row = '';
  var sorted = sortPerfs(perfs);
  var total = sorted.length;

  if (total > paginationLimit) {
    var paginationLinks = getPaginationLinks(total, paginationLimit, paginationPage);
    pagination_row = createPaginationRow(paginationLinks, paginationPage);
    sorted = sorted.slice(((paginationPage- 1) * paginationLimit), (paginationPage* paginationLimit));
  }
  sorted = restructureArray(sorted);
  return [pagination_row, sorted];
}
sortPerfs is a simple function that alphabetically orders data based on host/service name. The goal here is to have a default ordering rule so that you can go from one page to another without losing data.
As you can see from the code, if the number of graph is greater than the fixed limit paginationLimit, then a pagination row will be created. Next, an array containing all the links needed to move between dashboard pages is created using the function getPaginationLinks.
function getPaginationLinks (total, limit, currentPage) {
  var pages = Math.ceil(total / limit);
  var url = window.location.href;
  var pagesLink = [];
  var tempUrl = '';
  if (!searchForUrlParams('var-page')) {
    url = url + '&var-page=' + currentPage;
  }
  if (!searchForUrlParams('var-limit')) {
    url = url + '&var-limit=' + limit;
  }

  for (var i = 0; i <= pages + 1; i++) {
    if (i === 0 && currentPage !== '1') {
      var prevPage = Number(currentPage) - 1;
      tempUrl = url.replace('var-page=' + currentPage, 'var-page=' + prevPage);
      pagesLink[i] = {
        label: '<',
        url: tempUrl
      };
    } else if (i === pages + 1 && currentPage !== pages) {
      var followingPage = Number(currentPage) + 1;
      tempUrl = url.replace('var-page=' + currentPage, 'var-page=' + followingPage);
      pagesLink[i] = {
        label: '>',
        url: tempUrl
      };
    } else if (i !== 0 && i !== pages + 1) {
      tempUrl = url.replace('var-page=' + currentPage, 'var-page=' + i);
      pagesLink[i] = {
        label: i,
        url: tempUrl
      };
    }
  }

  return pagesLink;
}
It is then passed to createPaginationRow:
function createPaginationRow (paginationLinks, page) {
  var htmlContent = '<ul id="grafana_pagination" style="list-style: none;">';

  paginationLinks.forEach(function (obj) {
    var linkActive = '';
    if (String(page) === String(obj.label)) {
      linkActive = 'border-bottom: 2px solid #4a9e9a;';
    }
    var htmlA = '<a href="' + obj.url + '" onclick="location.reload();" target="_self" style="padding: 0 6px 3px 6px; text-decoration: none; color: #4a9e9a; ' + linkActive + '">' + obj.label + '</a>';
    var htmlLi = '<li style="float: left;">' + htmlA + '</li>';
    htmlContent = htmlContent + htmlLi;
  });

  htmlContent = htmlContent + '</ul>';

  var panel = {
    'id': 'pagination',
    'title': '',
    'span': 12,
    'type': 'text',
    'mode': 'html',
    'content': htmlContent,
    'links': [],
    'transparent': true
  };

  return {
    'collapse': false,
    'height': '70px',
    'panels': [panel],
    'repeat': null,
    'repeatIteration': null,
    'repeatRowId': null,
    'showTitle': false
  };
}
This function will create an HTML panel with no background, border or title. It contains a <ul> list with an <li> element for each link passed through the function.

Grafana Pagination
You can customize this function so that, for example, it doesn’t display all page links. The style can also be changed to integrate with your site design. This can be just the start for Grafana dashboard customization and enhancement; there is plenty more that we can create and improve in dashboarding.


Hi! Thank you for this tutorial. I would like to ask if there is any example of pagination in Grafana on GitHub? Right now my solution doesn’t work properly.
Hi Tomasz,
Unfortunately, I haven’t published this project on GitHub yet. But I would be happy if I could help you: feel free to ask for more details or information regarding this pagination development.
Thank you very much! Do all the functions you described should be placed in one file with scripted dashboard? How do you pass data from InfluxDB? There are also some coding errors like:
url = url + ‘&amp;var-limit=’ + limit;
for (var index = 0; index &lt; queryParams.length; index++)
Is there any chance to correct these errors?