Introduction
In this tutorial we will install and configure cAdvisor (Container Advisor) to collect performance data from a host machine and from each container running on it, and write then write that data into InfluxDB. After that it will be possible to visualize the collected performance data using Grafana.
We will use NetEye, on which InfluxDB and Grafana are already installed and configured.
Prerequisites
- A Linux machine with docker installed
In my case I followed this tutorial to create a CentOS 7 virtual machine with docker-ce installed: https://docs.docker.com/engine/installation/linux/docker-ce/centos/#install-docker-ce-1
- A second machine on which InfluxDB and Grafana are installed on top of NetEye
1. Installation and Configuration of cAdvisor
We will use the official cAdvisor docker image from google hosted on the docker hub.
Connect to the machine that you want to monitor, and execute this command:
# docker run \
  --volume=/:/rootfs:ro \
  --volume=/var/run:/var/run:rw \
  --volume=/sys:/sys:ro \
  --volume=/var/lib/docker/:/var/lib/docker:ro \
  --publish=8080:8080 \
  --detach=true \
  --name=cadvisor \
  google/cadvisor:latest
I’ve taken this command from the official guide: https://github.com/google/cadvisor/blob/master/docs/running.md
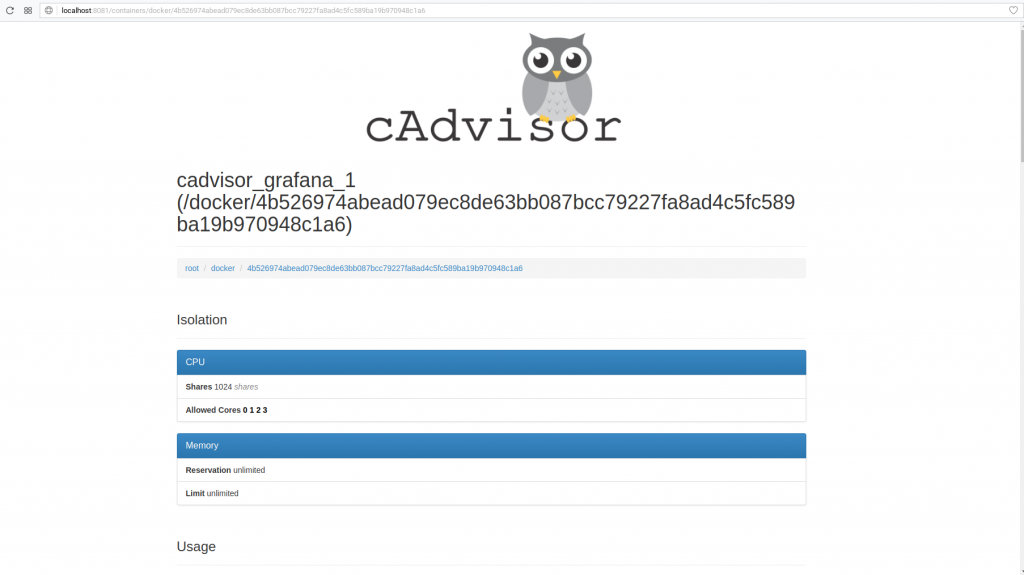
After downloading the image, cAdvisor will be executed in background. After installation, you can access the web interface using http://[ip/hostname]:8080 E.g.: http://localhost:8080. You should see this startup page:
If you want to expose cAdvisor on a different port, you need to edit the –publish option in the docker command above. If instead you don’t want to expose it, just don’t include the –publish option.
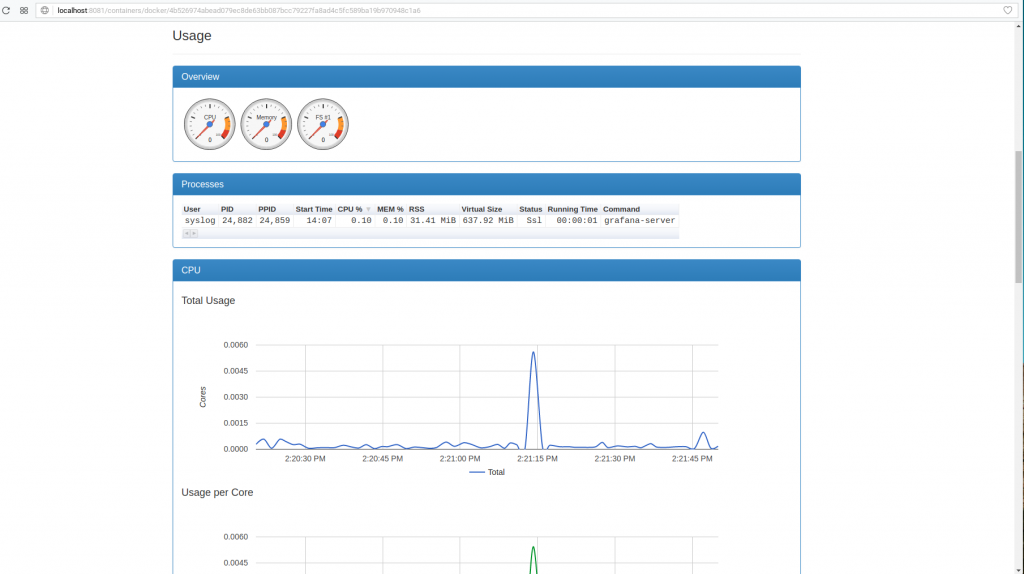
Now we can explore the performance data of the host machine and of all containers running on it using the web interface of cAdvisor.
2. How to write data into InfluxDB
cAdvisor doesn’t write any data locally in a persistent way. That means that if we want to visualize old data, we need to store it in a persistent database like InfluxDB.
We need to create a new database in InfluxDB where we can store our performance data. To do this we need to connect to the machine on which InfluxDB is running and execute this command:
# influx
Connected to http://localhost:8086 version 1.2.2
InfluxDB shell version: 1.2.2
> create database cadvisor
> exit
If we are using InfluxDB installed on NetEye, we will need to expose it. To do this we need to create an HTTP proxy using Apache.
Open the main configuration file:
# vim /etc/httpd/conf/http.conf
and add this at the end of it:
Listen 8087
<VirtualHost *:8087>
ProxyPass / http://localhost:8086/
ProxyPassReverse / http://localhost:8086/
        <Location />
          Order deny,allow
          Deny from all
        Allow from <the-ip-of-your-docker-machine>
        Allow from <another-machine>
        </Location>
</VirtualHost>
then save and restart httpd:
# service httpd restart
Note: You can restrict access to a group of IP addresses by using CIDR or netmask. More details can be found here: http://httpd.apache.org/docs/2.2/en/mod/mod_authz_host.html.
Now we need to delete the old cAdvisor container and create a new one with the storage driver options that will allow us to write into our new InfluxDB database.
# docker stop cadvisor
# docker rm cadvisor
# docker run  \
  --volume=/:/rootfs:ro \
  --volume=/var/run:/var/run:rw \
  --volume=/sys:/sys:ro \
  --volume=/var/lib/docker/:/var/lib/docker:ro \
  --publish=8081:8080 \
  --detach=true \
  --name=cadvisor \
  google/cadvisor:latest  -storage_driver=influxdb \
    -storage_driver_host=<ip-of-neteye>:8087
Note: Additional options for cAdvisor can be found here: https://github.com/google/cadvisor/blob/master/docs/storage/influxdb.md
To verify that everything works correctly, connect to NetEye and execute this command:
# influx
Connected to http://localhost:8086 version 1.2.2
InfluxDB shell version: 1.2.2
> use cadvisor
> show measurements
name: measurements
name
----
cpu_usage_per_cpu
cpu_usage_system
cpu_usage_total
cpu_usage_user
fs_limit
fs_usage
load_average
memory_usage
memory_working_set
rx_bytes
rx_errors
tx_bytes
tx_errors
If you don’t see the same results, then try these steps:
- Wait a few minutes and try again, because cAdvisor by default writes blocks of data to InfluxDB every few minutes
- Check the log of cAdvisor using:
docker logs cadvisor- Check the InfluxDB log using:
tail -f /var/log/neteye/influxdb/influxd.log- Check the Apache log using:
tail -f /var/log/httpd/error_log- If you can’t resolve the problem on your own, feel free to comment here and I will try to help you.
Conclusions
Now that we know how to install and configure cAdvisor on one machine, we can do the same on multiple machines, and we can even deploy it on a Kubernetes cluster and send all collected data to NetEye.
In the next part of this tutorial I will explain how to create a Grafana dashboard to visualize the collected data.


