How Much Bandwidth Do Your IT Services Actually Use?
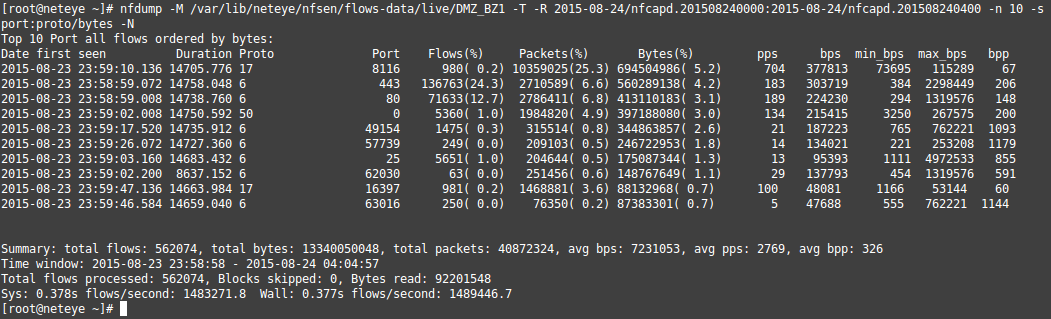
Nfdump displays the traffic among network devices and thereby allows seeing how much bandwidth is consumed by the single flows. This may be a useful information, but indeed, it is not very meaningful. Since Nfdump just lists the single flows between two ports (including the generated traffic), it is difficult to understand at a glance:
To which service a flow belongs
How many flows (and traffic) a certain service generates
Nfdump just allows to display the traffic among network devices and thereby, seeing how much bandwidth is consumed by the single flows.
Actually, we want to know, which service generated most traffic during a certain period. To get this information, we have to associate the single flows to a certain service. How can we do this? – Based on the network ports we can identify, which flows belong to which service. Summarizing all flows, which belong to one service, we can see at a glance, how much bandwidth was consumed by the single services.
Traffic generated by different services
We integrated a new functionality to the NetEye Reporting to visualize the generated traffic by the different IT service. This functionality allows you, within the sections Top Flow Statistics and Top In/Out Flows, to classify the flows according to the network ports and to associate them to specific services (like HTTP, IMAP, SMTP and so on). Beside the default network services, you have the possibility to specify your own services and to associate specific ports to them.
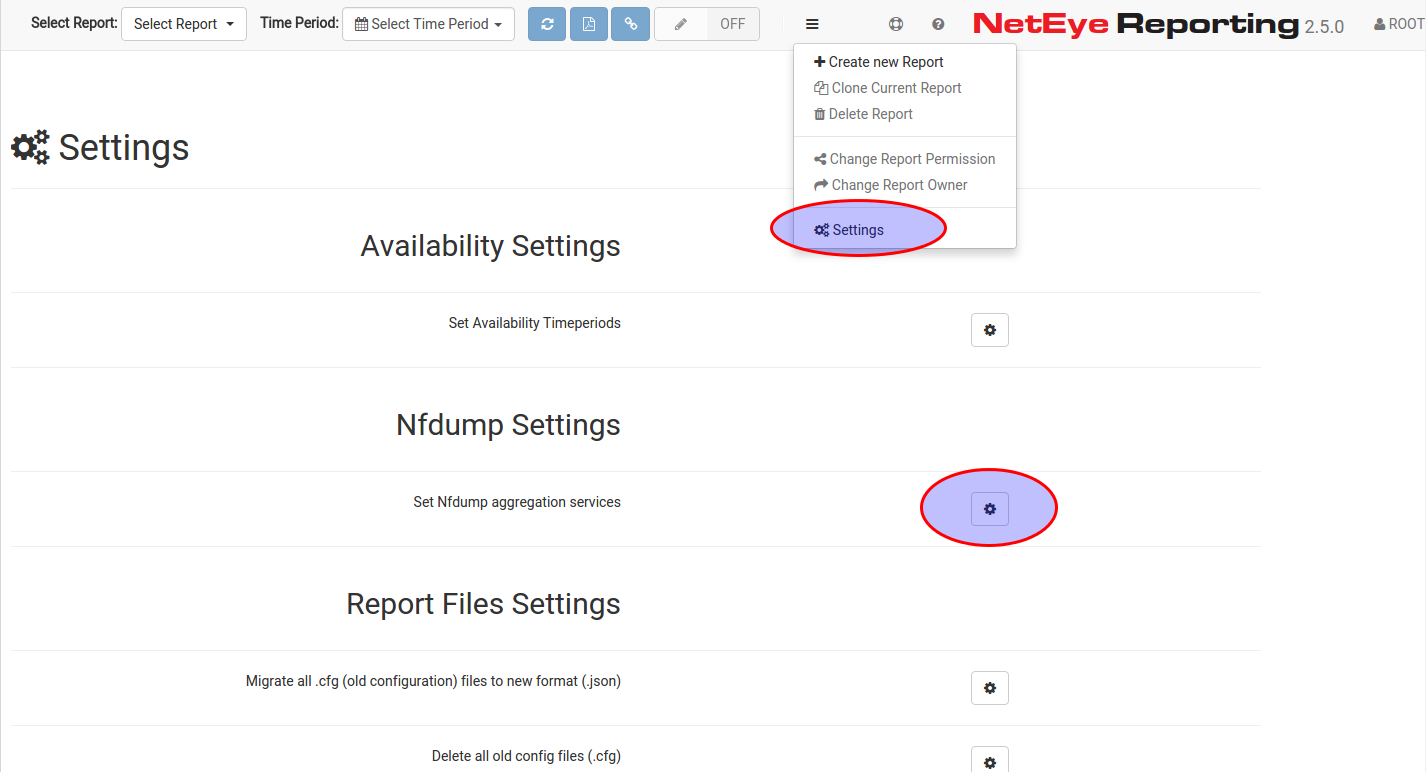
Example: In your network, the ERP system (exmpl.: SAP or Microsoft Dynamics) may use all TCP ports from 50000 to 59999 and therefore you want to associate all that flows to the ERP service. To do so, open the NetEye Reporting Settings from the main menu in the section Nfdump Settings, here you will find Set Nfdump aggregation services (see picture below).
Define Nfdump aggregations [1/2]
The displayed dialog allows you to open an already created service-set or to create a new one, where you can specify the ports, which have to be associated to the new service. Additionally, you can also choose to clone an already created service-set by clicking on the “clone” button.
Define Nfdump aggregations [2/2]
Once you defined the service-set you can choose which one to use in your report (in the sections Top Flow Statistics and Top In/Out).
Hi, my name is Sandro and I am the youngest member of the Neteye team. I graduated in 2013 in Applied Computer Science at the Free University of Bolzano but I started working as software engineer at Würth-Phoenix already in May 2012. My main competence is the development and improvement of the “Real User Experience” solution.For me computer programming is not just work, but i like scripting and creating my own software also in my free time. Already as a child I was amazed by computers and their technology. So at the age of 12 I bought the book “C for dummies” and started learning programming on my own 🙂 Later on I discovered the open-source world and I started loving it from the first moment.In my free time I also like mountain biking, hiking, and of course playing the trombone in various music bands.
Author
Sandro Santinato
Hi, my name is Sandro and I am the youngest member of the Neteye team. I graduated in 2013 in Applied Computer Science at the Free University of Bolzano but I started working as software engineer at Würth-Phoenix already in May 2012. My main competence is the development and improvement of the “Real User Experience” solution.For me computer programming is not just work, but i like scripting and creating my own software also in my free time. Already as a child I was amazed by computers and their technology. So at the age of 12 I bought the book “C for dummies” and started learning programming on my own :-) Later on I discovered the open-source world and I started loving it from the first moment.In my free time I also like mountain biking, hiking, and of course playing the trombone in various music bands.


![Define Nfdump aggregations [2/2]](http://www.neteye-blog.com/wp-content/uploads/2015/08/Selection_080.png)