


08. 07. 2024
Unified Monitoring

16. 03. 2015
Sandro Santinato
NetEye
NetEye Reporting con le nuove statistiche Top Flow e Top In/Out Flows
Con l’ultima versione 2.1 del nostro tool di Reporting rilasciato con NetEye 3.5 abbiamo introdotto due nuove funzionalità davvero interessanti che si occupano dell’analisi delle statistiche NetFlow.
Se non conoscete molto bene NetFlow, NetFlow è una funzionalità che consente di archiviare il traffico di rete IP delle vostre nBox, Il traffico viene raccolto proprio come passa attraverso l’interfaccia di rete. Utilizzando strumenti quali Nfdump quindi i flussi di rete possono essere esportati ed analizzati.
Per questo motivo abbiamo deciso di introdurre nel nostro nuovo strumento di reporting la possibilità di visualizzare le statistiche NetFlow in base a periodi temporali definiti direttamente sotto forma di reports. Potete infatti trovare queste due nuove sezioni entrando nella modalità di modifica di un report e aggiungendo una di loro, come riportato nell’immagine sottostante.
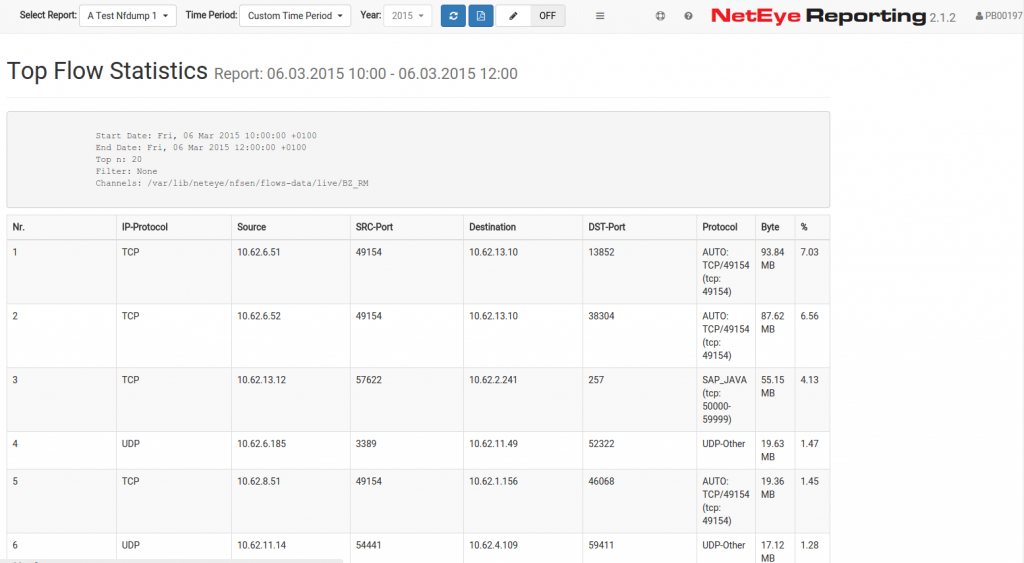
La sezione Top Flow Statistics mostra i maggiori flussi all’interno di un periodo temporale in modo discendente in base alla colonna dei Bytes. Inoltre vengono anche visualizzati i protocolli di rete IP, gli indirizzi IP sorgenti e destinatari e le porte sorgenti e destinatarie. Questa funzionalità consente quindi di analizzare i flussi maggiori in un tempo definito, identificando quale traffico influenza maggiormente la rete.
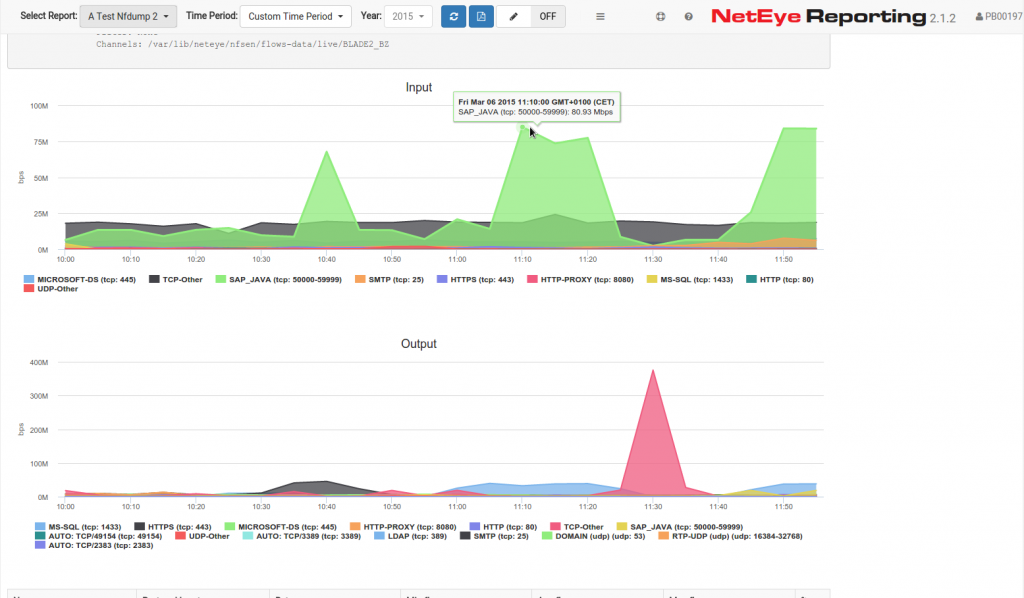
Utilizzando la sezione Top In/Out Flows potrete invece analizzare i flussi di rete aggregati in base al loro protocollo di rete e ordinati in base alla loro percentuale di byte. Questa sezione mostra i flussi aggregati in due righe di grafico, one per i flussi in entrata e l’altra per quelli in uscita.
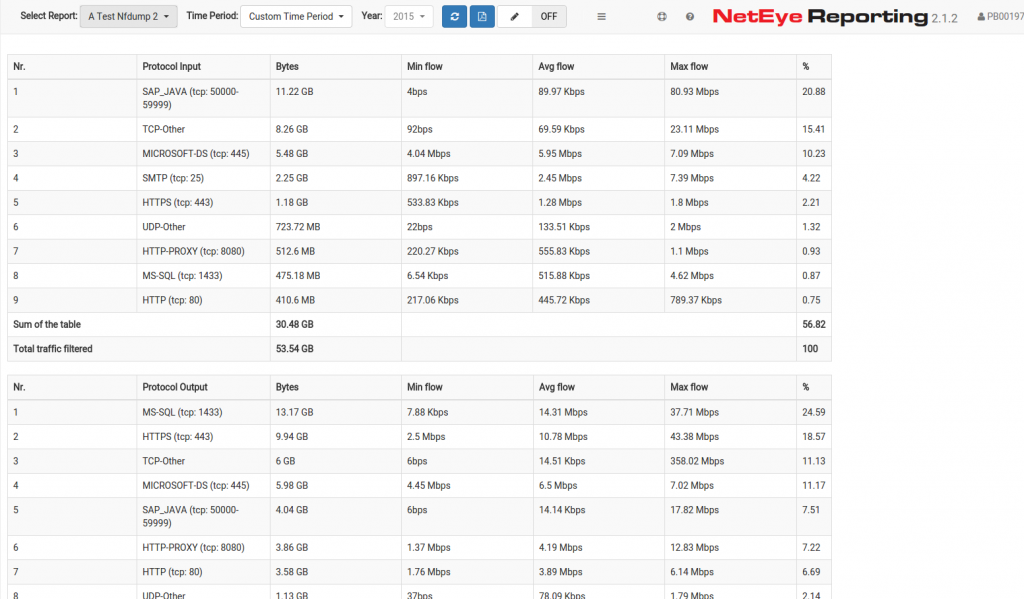
Inoltre vengono visualizzati anche i dettagli dei flussi aggregati all’interno di due tabelle posizionate vicino al grafico e ordinate in base alla percentuale di bytes e separate in base ai flussi in entrata e uscita.
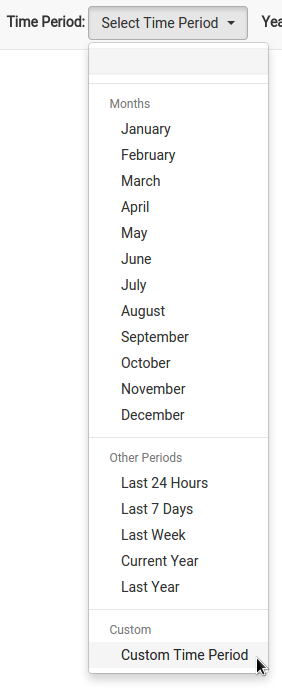
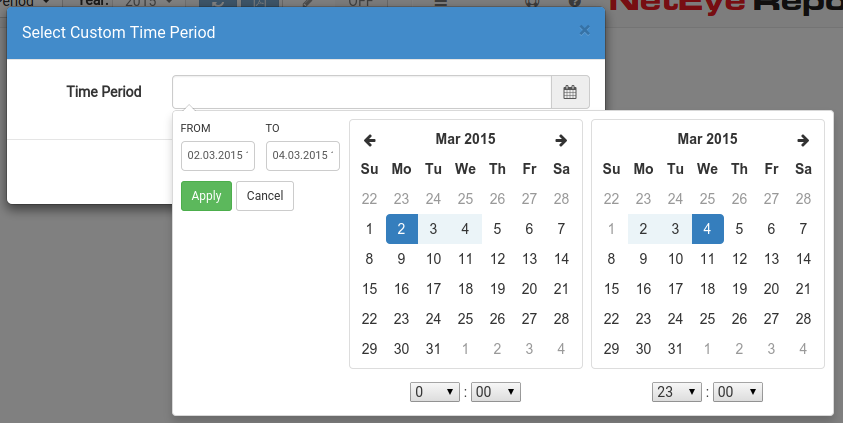
Ricordatevi che se non siete soddisfatti con il periodo temporale predefinito come 24 ore o gli ultimi 7 giorni, potrete specificare un mese preciso o un periodo personalizzato in base alle vostre necessità selezionando la data d’inizio e fine.
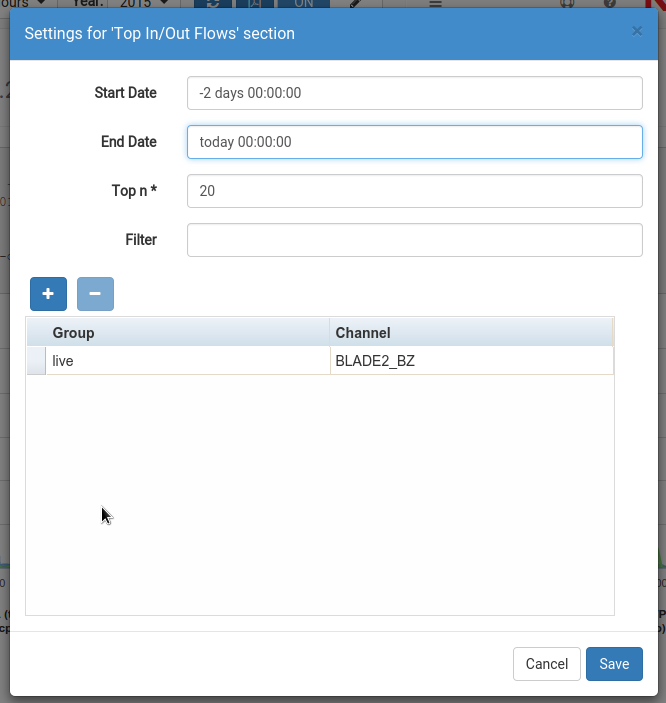
Oppure potrete anche avere la possibilità di specificare i periodi temporali direttamente all’interno delle impostazioni delle due nuove sezioni, che possono essere inseriti in ogni formato.

Sandro Santinato
Developer at Würth Phoenix
Hi, my name is Sandro and I am the youngest member of the Neteye team. I graduated in 2013 in Applied Computer Science at the Free University of Bolzano but I started working as software engineer at Würth-Phoenix already in May 2012. My main competence is the development and improvement of the “Real User Experience” solution.For me computer programming is not just work, but i like scripting and creating my own software also in my free time. Already as a child I was amazed by computers and their technology. So at the age of 12 I bought the book “C for dummies” and started learning programming on my own 🙂 Later on I discovered the open-source world and I started loving it from the first moment.In my free time I also like mountain biking, hiking, and of course playing the trombone in various music bands.
Author
Latest posts by Sandro Santinato
15. 11. 2017
Downloads / Release Notes, NetEye
Updated Package neteye-ocsng-2.1.2_neteye1.0.2-1 (for NetEye 3.11 + 3.10 + 3.9)