Real User Experience – TCP Plugin
Until now, the NetEye Real User Experience was able to view the key performance indicators linked only to those applications that are using the http / https protocols.
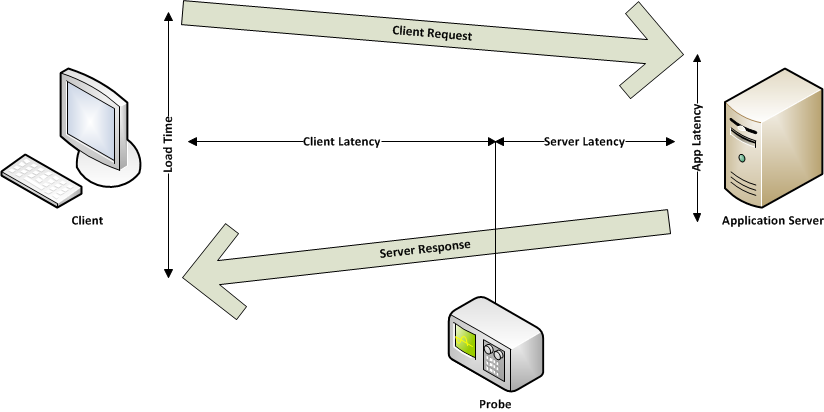
The new TCP plugin allows to display KPI for all the applications that use the TCP protocol with a client request / server response model:
The plugin is able to extract information regardless of the application protocol implemented in the layer 7, if the communication model is the expected one, which in effect is the one used by most applications.
The qualitative information that the plugin can export are:
| KPI | Description |
| Client/Server network latency | network latency on the client and server side |
| Application server latency | processing time of the request, without network time |
| Load Time | time elapsed from the client request to the last byte sent by the application, it represents the total time to get the complete response by the Application |
| Application Throughput | application response speed |
| Network Throughput | data rate |
| Retransmitted – OOO – Fragmented Packets | out of sequence, retransmitted or fragmented packets |
| Receive window close | how many times the client or the server has reported a situation of a received full buffer, and therefore it has not been able to quickly process the request |
| Reset | connection reset situations based on communication errors |
In addition to these qualitative values the TCP plugin can also collect quantitative data:
| KPI | Description |
| Bytes | number of bytes transmitted from the client or server comprising the TCP stack header |
| Payload bytes | only the bytes of the application request or response content |
| Packets | number of packets sent from the client or server |
| Transfer time | data transmission time (upload / download time) |
SSL – TLS
The TCP plugin is able to provide the above KPIs also for the TCP communications that make use of SSL / TLS without having the need to install the private key in use. This allows you to track the performance of encrypted communications by third parties, for instance in the cloud.
To be able to combine in an application the ssl/tls flow is necessary to know the ip / port of the provided service or alternatively the hostname / port and that the client uses the tls SNI ( service name indicator) extension.
The SNI extension is useful in cases where you control a service with many associated IPs and if these IPs are changing over time (i.e. cloud services). With SNI we can recognize the target service from the hostname / alias that the client uses to connect, and in this way we are independent from the changes of the IPs associated with the service.
This is an example of visualization of TCP data grouped by netgroups:


