Real User Experience Monitoring with NetEye
In order to analyze the quality level of the delivered IT services the traditional monitoring systems used to focus exclusively on the control of hardware and software components and the network, neglecting the measurement of the performance experienced by the end user.
Until now it was not always possible, in fact, to give a precise answer to the following questions:
- How is it possible to promptly identify if the slow downs are caused by the systems, by the network, by the applications or by the Cloud?
- What is the impact and how new software releases are influencing the performances?
- How is it possible to prioritize the incidents by identifying the number of impacted users?
- How can we obtain objective values and alarms in case of problems of performances?
- Is it possible to plan the throughput to subscribe a Cloud contract, avoiding to purchase unnecessary services?
Our approach of Real User Experience Monitoring tries to address these requirements by providing objective measurements on the performances experienced by the users.
The integration of the Real User Monitoring into a monitoring system offers an overview of the data able to identify the quality of the delivered IT services. Thanks to the analysis of the network communication flows, the Real User Experience Monitoring is able to measure the response time of each single user transaction and to archive the Key Performance Indicators, such as the application latency, the network latency, the client latency, the load time, the throughput, the number of impacted users or the retransmitted http packets.
The integration of NetEye with ntop
The Real User Experience Monitoring allows, for instance, to evaluate the delivery of the IT services of a public or private Cloud provider.
Our solution consists of the integration between the network traffic analyzer nBox with NetEye. nBox is located in the network infrastructure and passively registers all the network flows, NetEye archives and analyzes the data as well as it provides statistics and alarms.
The nBox appliance is a probe that passively analyzes the network flows without influencing the existing infrastructure. To identify possible performance problems a periodic monitoring is performed on the network, client, server and application for every single user’s request. The slowdowns in fact are identified by defining minimum thresholds updated automatically at regular intervals. In case there are deviations from these values , alarms are generated and it will be possible to determine whether the cause is attributable to the network, server, client or application.
Use cases of Real User Experience Monitoring
Here are some examples of how our Real User Experience Monitoring solution has been adopted by our customers and what are the benefits they have experienced with its use.
What is the impact on the users? Whose fault is it?
Did you ever receive a call from a user who complains, for example, that he is not able to work in an acceptable way with SharePoint, Outlook or any other application? First, it is not always clear whether there are any delays or is it just a subjective impression, moreover (without performance metrics) it is not even possible to identify how many users are experiencing the same performance problems. Once stated that the problem exists how do you know if the cause is attributable to the client, the server, the network or to the application itself? Where is it possible to discover bottlenecks?
It can happen the following scenario: the application manager controls and passes the problem to network administrators who, in turn, analyzes and finds no fault so he sends the problem to the system engineers who ensure the proper functioning of the systems as well.
How do you solve the problem then? Without any precise data on the transactions and the performances you cannot clearly define the responsibilities of the involved components, and generally a vicious circle will be generated without having the possibility to go back to the root of the problem.
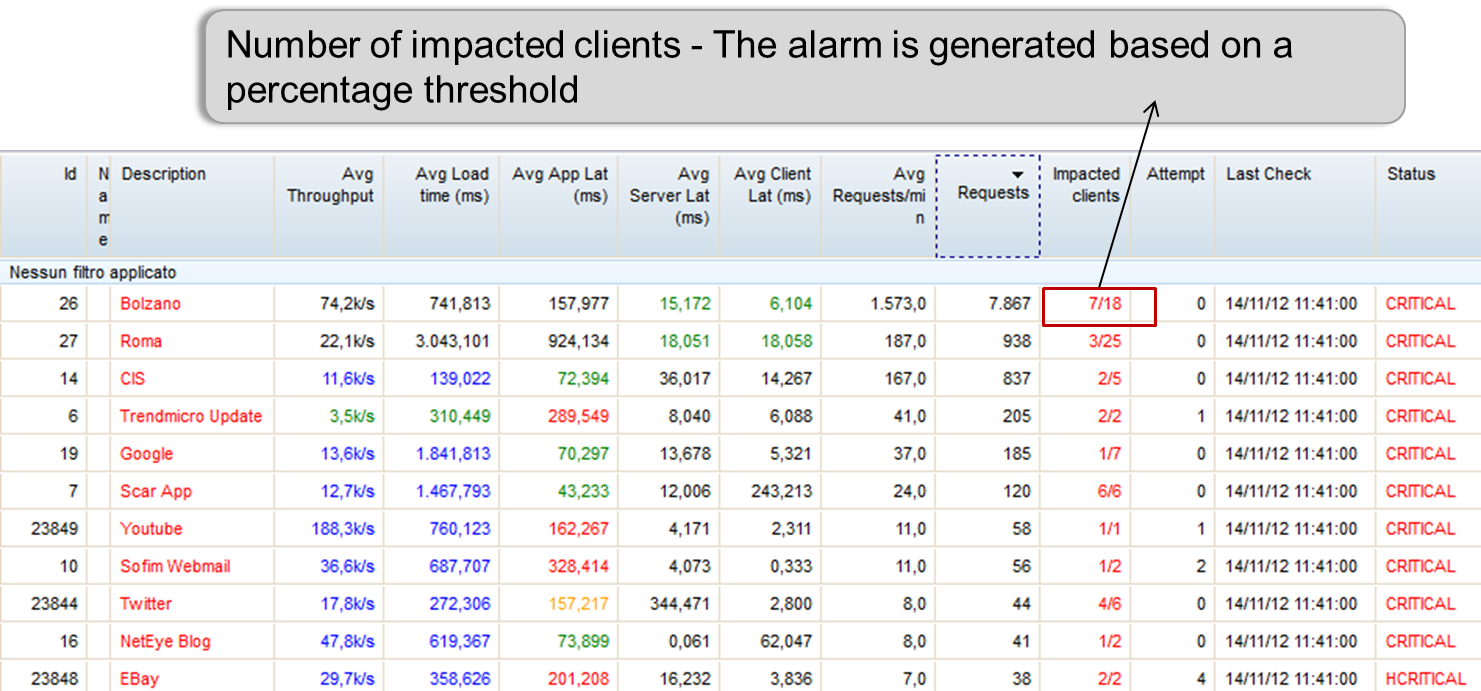
The Real User Experience Monitoring, instead, offers the possibility to identify the root causes of delays by measuring the latencies. It is possible to configure percentage thresholds and be notified if there are any deviations from the latencies, these values in addition allow you to quickly identify if the cause of the slowdown is attributable to the client, network, or to the application itself.
Geo-localization of alarms and prioritization of the incidents
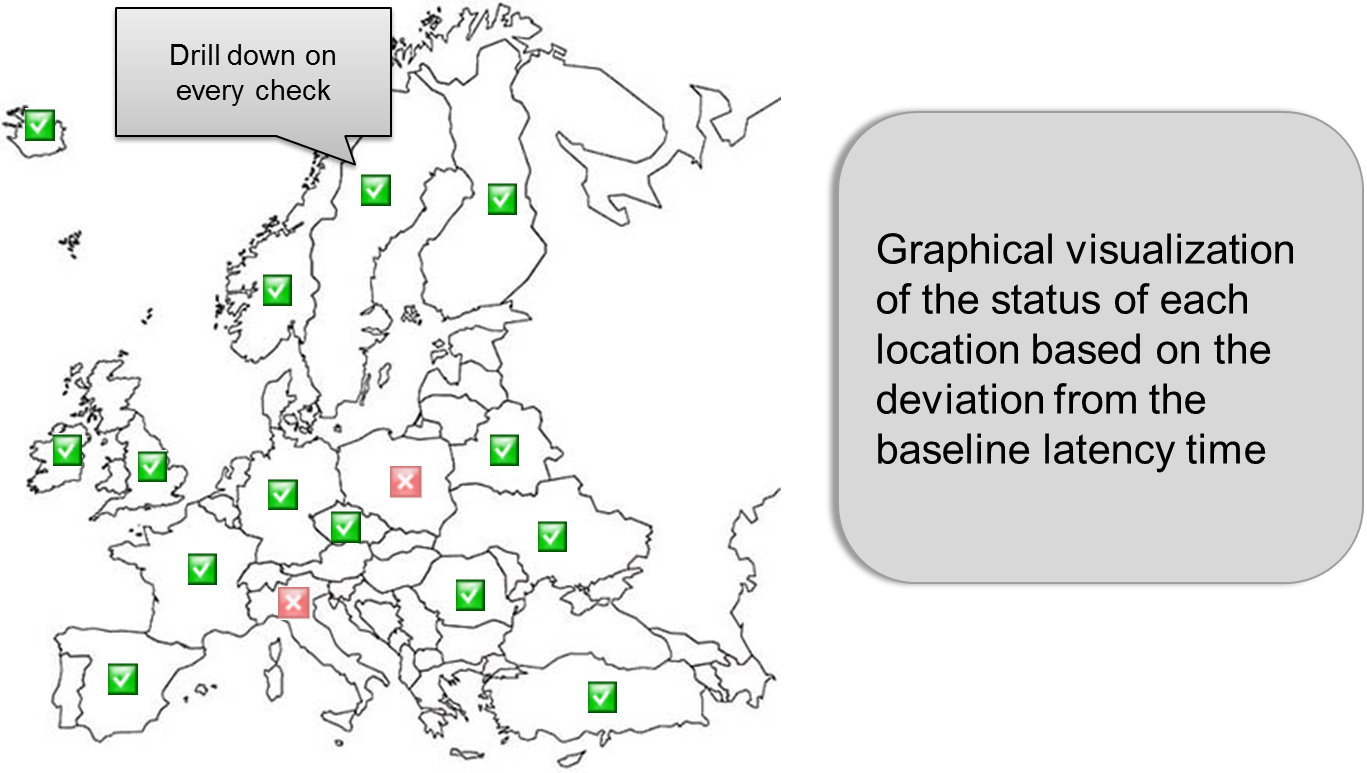
Our Real User Experience Monitoring offers the possibility to visually locate the problems on a map. In this way the Service Management will be able to navigate through the details of data and prioritize the problems based on their impact and urgency. It is possible, in fact, to identify the number of impacted users and also display the exact application that is experiencing performance problems. Evaluating the impact and urgency the service management have the possibility to solve the various performance problems with the right priority.
Impact on the performance caused by anti-virus, intrusion detection systems or traffic shapers
Are you able to evaluate the performance impact on your network of an antivirus, a traffic shaper or an intrusion detection systems?
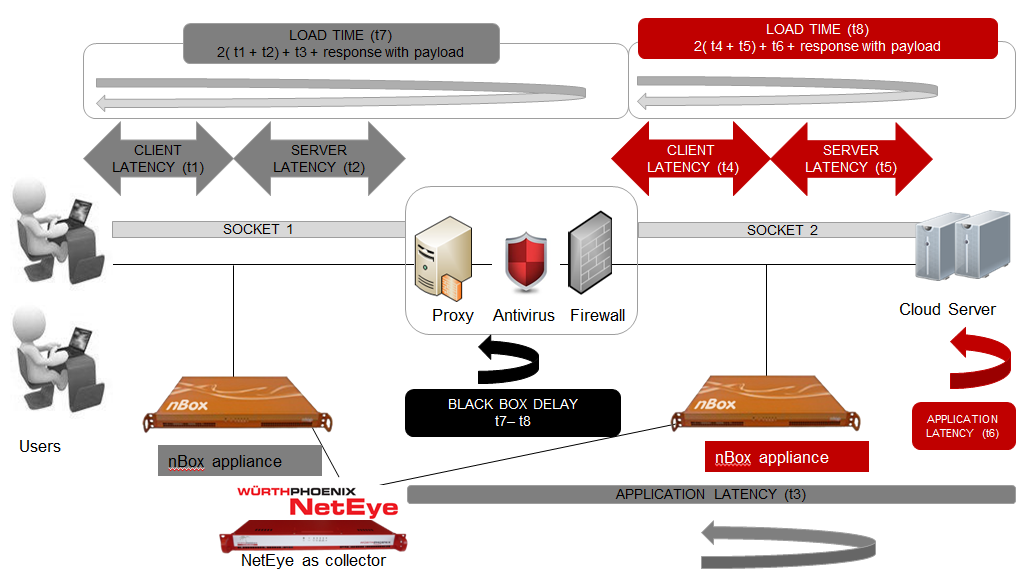
Thanks to the measurements provided by our Real User Experience Monitoring you are able to identify if the black box – consisting for example of antivirus, traffic shaper, load balancers or intrusion detection system – is the cause of delays. As shown by the image below, our solution calculates the delay of the black box and allows to determine whether the delays caused by these systems are acceptable or if necessary to replace them or to edit their configurations.

Balck box delay calculation to identify the impact on the network performance of an antivirus, a traffic shaper, a load balancer or a intrusion detection system
Cloud contracts: throughput identification
The monthly fee for many cloud services contracts is based on the throughput, that is the amount of data transmitted in a unit time (b / s). The Real User Experience Monitoring is helping you to measure this value and allow to plan the actual throughput based on your real needs. This is the main reason why this metric acquires considerable importance when you consider the required estimation you need to perform to purchase and also to control your cloud services.
Main features
In this post I have provided some of the many examples of how our solution is able to support and help our customers to optimize the performance of their infrastructures and to improve the satisfaction of their users .
I would like now to conclude by giving you some of the key features that characterize our solution:
- Display of performance divided into geographical areas, workstations, applications or groups of applications.
- Alarms in case of deviation from the performance baselines.
- Quick identification of the root cause of performance problems, identify if the fault is related to the network, the application, the client or the Cloud service provider Cloud.
- Prioritization based on the number of impacted users.
- Display of throughput and load time.
- Number of retransmitted packets.
- Identification of browser, OS and used devices.
- Identification of HTTP returned codes for each transaction.
- Performance monitoring the of all web applications and cloud services.
- Possibility to analyze each single HTTP user transaction.
- Identification of the source and target IP addresses.


